SHAP サマリー(ビースウォーム)
全学区・全特性の SHAP 値を特性の値で色分けし、平均 |SHAP| による重要度を添えます。
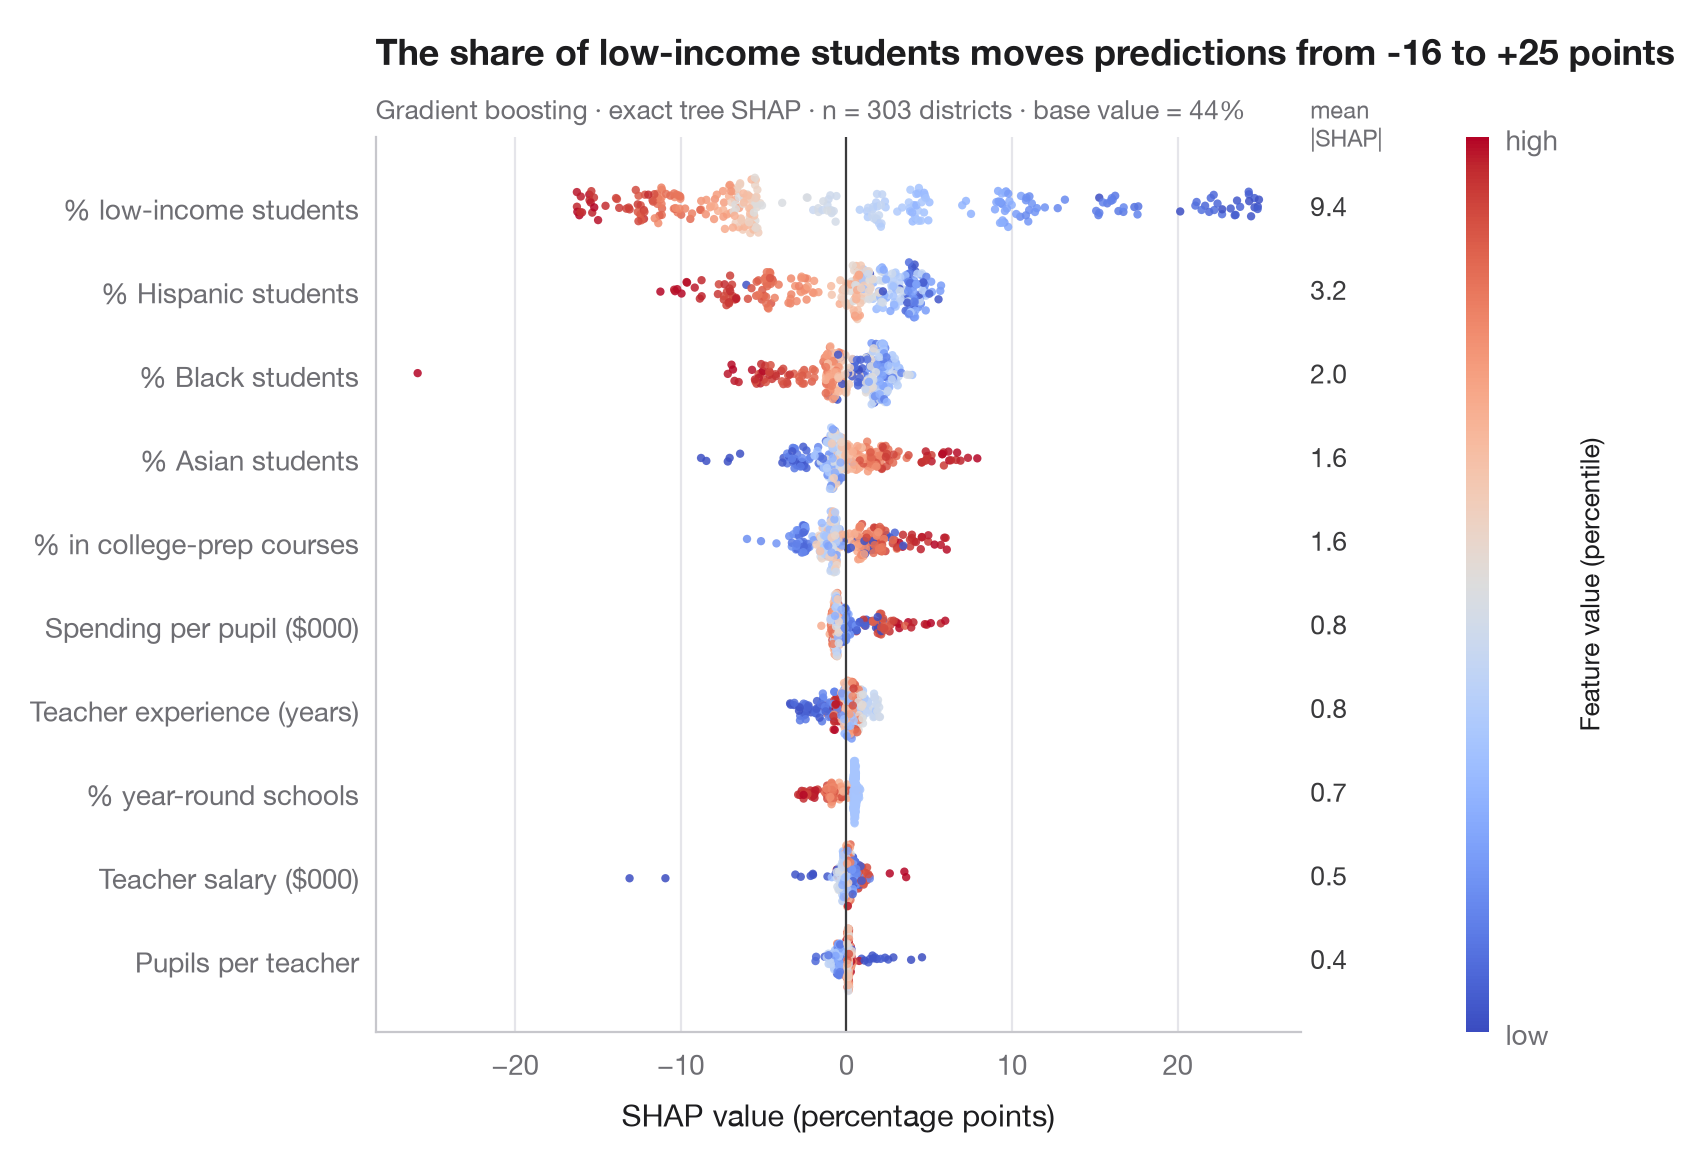
SHAP(SHapley Additive exPlanations;Lundberg・Lee, 2017)は、各予測を特徴量ごとの加法的な寄与に分解し、ベース値 + 寄与の合計 = 予測値 となるようにします。寄与は協力ゲーム理論のシャープレイ値で、特徴量を加えうるあらゆる順序にわたる、各特徴量の平均的な限界効果です。
ビースウォームは学区と特徴量の組ごとに点を 1 つ描きます。位置は SHAP 値、すなわちその特徴量がその学区の予測をどれだけ押し上げたか押し下げたかを表し、色は特徴量そのものの値(低い=青、高い=赤)です。特徴量は平均 |SHAP| の順に並べ、右側に全体的な重要度として示します。右に赤、左に青ときれいに分かれていれば単調な効果、色が混ざっていれば非線形性や交互作用の兆候です。
データは statsmodels 付属の 1998 年 STAR テストにおけるカリフォルニア州の学区 303 件(sm.datasets.star98)で、目的変数は数学で全国中央値を上回った生徒の割合(パーセントポイント)、これを学区の 10 の特性から予測します。モデルは勾配ブースティング回帰で、木モデル用の厳密な SHAP 値は shap.TreeExplainer によります。ギャラリーのスタイルに合わせて図は Matplotlib で描いています。shap.plots.beeswarm を使えば 1 行で似た図が得られます。
コードおよび図中のテキストは英語です。
import matplotlib.pyplot as plt
import numpy as np
import shap
import statsmodels.api as sm
from sklearn.ensemble import GradientBoostingRegressor

# Data: 303 California school districts; outcome = % of students above the national median in maths
d = sm.datasets.star98.load_pandas().data
y = 100 * d["NABOVE"] / (d["NABOVE"] + d["NBELOW"])
names = {"LOWINC": "% low-income students", "PERASIAN": "% Asian students", "PERBLACK": "% Black students",
         "PERHISP": "% Hispanic students", "AVYRSEXP": "Teacher experience (years)",
         "AVSALK": "Teacher salary ($000)", "PERSPENK": "Spending per pupil ($000)",
         "PTRATIO": "Pupils per teacher", "PCTAF": "% in college-prep courses",
         "PCTYRRND": "% year-round schools"}
X = d[list(names)]
model = GradientBoostingRegressor(learning_rate=0.05, n_estimators=300, max_depth=2,
                                  subsample=0.8, random_state=0).fit(X, y)

# Exact SHAP values for tree ensembles
sv = shap.TreeExplainer(model).shap_values(X)          # shape: (districts, features)
importance = np.abs(sv).mean(axis=0)
order = np.argsort(importance)                          # least important at the bottom

fig, ax = plt.subplots(figsize=(8, 5.6))
rng = np.random.default_rng(0)
cmap = plt.get_cmap("coolwarm")
for i, j in enumerate(order):
    v = sv[:, j]
    xv = X.iloc[:, j].rank(pct=True).to_numpy()         # colour = percentile of the feature value
    # Beeswarm-style vertical jitter: wider where the points are denser
    hist, edges = np.histogram(v, bins=60)
    dens = hist[np.clip(np.digitize(v, edges) - 1, 0, len(hist) - 1)] / hist.max()
    jitter = rng.uniform(-1, 1, len(v)) * 0.38 * np.sqrt(dens)
    ax.scatter(v, i + jitter, c=xv, cmap=cmap, s=9, alpha=0.85, lw=0, vmin=0, vmax=1)
    ax.text(1.01, i, f"{importance[j]:.1f}", transform=ax.get_yaxis_transform(), va="center",
            fontsize=9.5, color="#3A3A3C")
ax.axvline(0, color="#3A3A3C", lw=0.8)
ax.set_yticks(range(len(order)), [names[X.columns[j]] for j in order])
ax.set_xlabel("SHAP value (percentage points)")
ax.grid(axis="x"); ax.grid(axis="y", visible=False)
ax.text(1.01, len(order) - 0.35, "mean\n|SHAP|", transform=ax.get_yaxis_transform(),
        fontsize=8.5, color="#6E6E73", va="bottom")

cb = fig.colorbar(plt.cm.ScalarMappable(cmap=cmap), ax=ax, pad=0.09, aspect=40, ticks=[0, 1])
cb.ax.set_yticklabels(["low", "high"])
cb.set_label("Feature value (percentile)", fontsize=9.5)
cb.outline.set_visible(False)

low = sv[:, list(X.columns).index("LOWINC")]
ax.set_title(f"The share of low-income students moves predictions from {low.min():+.0f} to {low.max():+.0f} points", pad=26)
ax.text(0, 1.02, f"Gradient boosting · exact tree SHAP · n = {len(X)} districts · "
        f"base value = {model.predict(X).mean():.0f}%", transform=ax.transAxes, fontsize=9.5,
        color="#6E6E73")
plt.show()
図にはオプションの PyStatlas スタイル を使用しています。同じ見た目にするには plt.style.use("pystatlas.mplstyle") を追加してください。
データの出典
- California STAR test results, 1998 (303 school districts). Gill, J. (2001). Generalized Linear Models: A Unified Approach (Quantitative Applications in the Social Sciences, No. 134). Sage. https://www.statsmodels.org/stable/datasets/generated/star98.html
Original data from the California Department of Education's Standardized Testing and Reporting (STAR) program, 1998. Subset distributed with statsmodels (sm.datasets.star98) with the author's permission.
これらの例は統計手法を説明するためのものです。図のタイトルは、この特定のデータ(多くは小規模で、古く、部分的な標本)で図が示す内容を述べたものであり、実質的な問いに対する著者の立場ではありません。解釈、背景、データの質については、ここに挙げた元の出典を参照してください。
引用方法
PyStatlas は Thierry Warin が作成・運営しています。研究や業務に役立った場合は、ぜひ引用してください。
Warin, T. (2026). SHAP summary (beeswarm). In PyStatlas: A Python Gallery of Statistical Graphics for the Social Sciences. https://warint.github.io/pystatlas/machine-learning/shap-beeswarm/
@misc{warin2026statlas,
  author       = {Warin, Thierry},
  title        = {PyStatlas: A Python Gallery of Statistical Graphics for the Social Sciences},
  year         = {2026},
  howpublished = {\url{https://warint.github.io/pystatlas/}},
  note         = {Source code: https://github.com/warint/pystatlas}
}機械学習のその他のグラフ
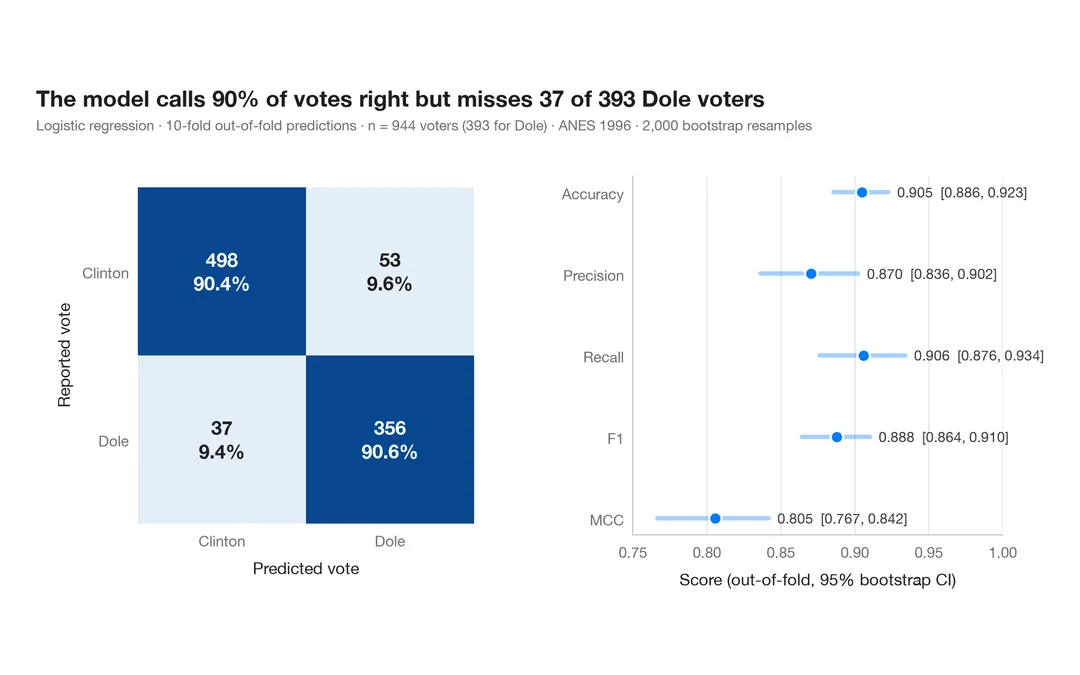
指標付き混同行列
1996 年にドールに投票した人をロジスティック回帰がどれだけ当てられるか。件数と行ごとの割合を示す交差検証の混同行列に、主要指標のブートストラップ区間を添えます。
yardstick::conf_mat() + autoplot()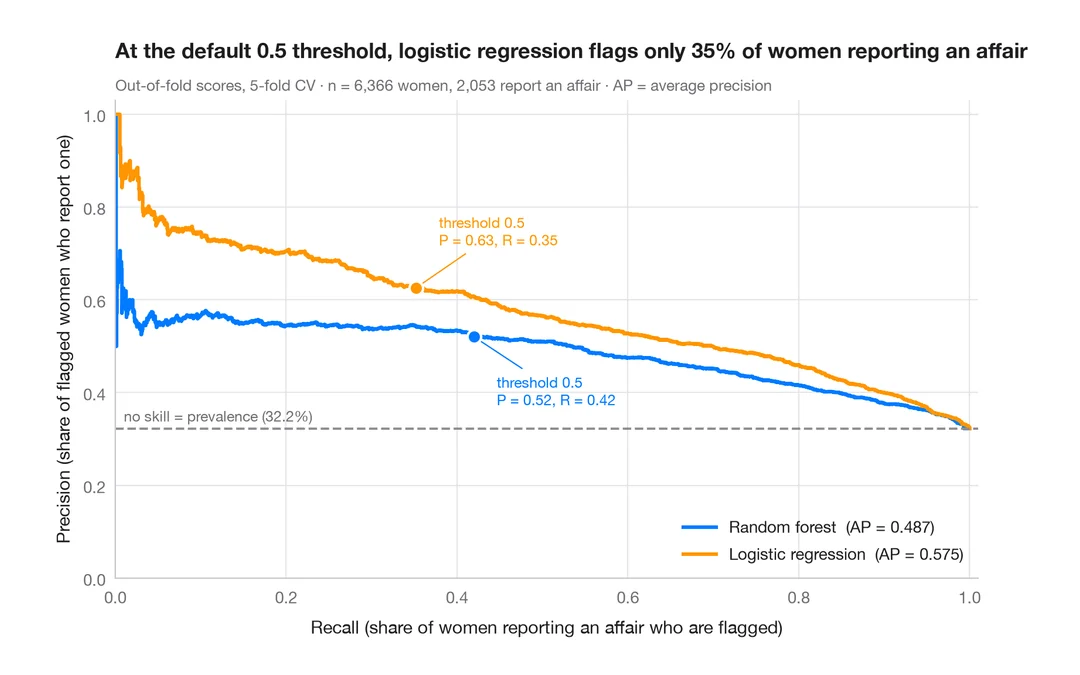
適合率–再現率曲線
既婚女性のうち誰が婚外関係を申告するかを予測する 2 つの分類器の、交差検証による適合率–再現率曲線と、平均適合率、無技能のベースライン。
yardstick::pr_curve() + autoplot()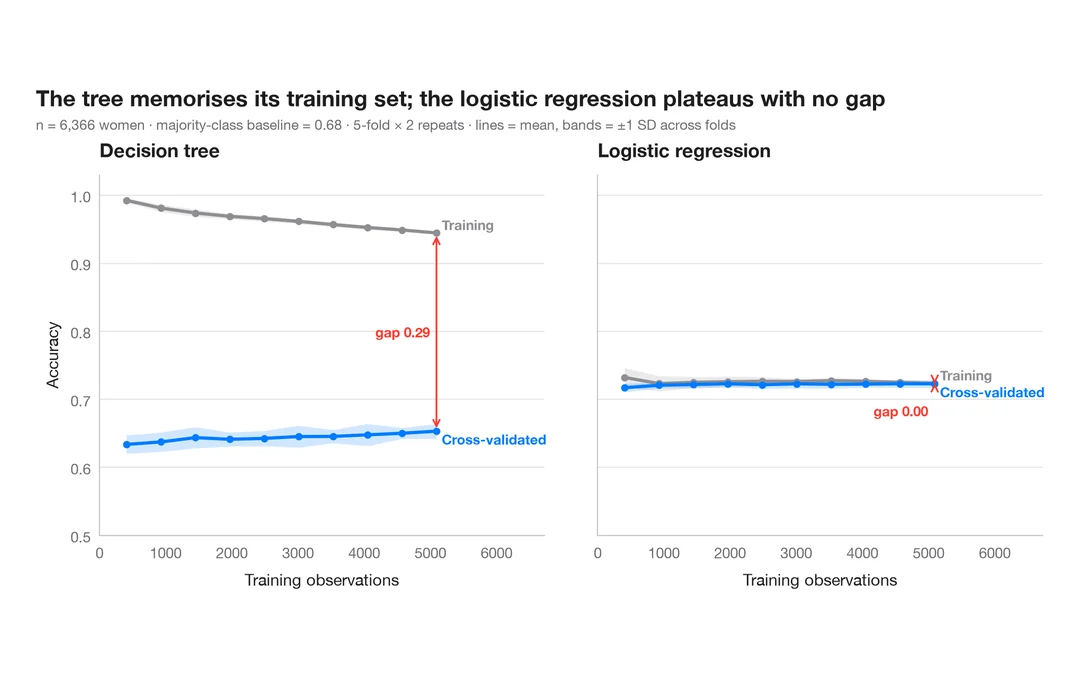
学習曲線
既婚女性のうち誰が婚外関係を申告するかを予測する 2 つのモデルについて、訓練データを増やしたときの訓練正解率と交差検証正解率を示します。
caret::learning_curve_dat() + ggplot()