k-means 轮廓图
美国各州是否分成截然不同的社会类型?k-means 聚类及其轮廓宽度。
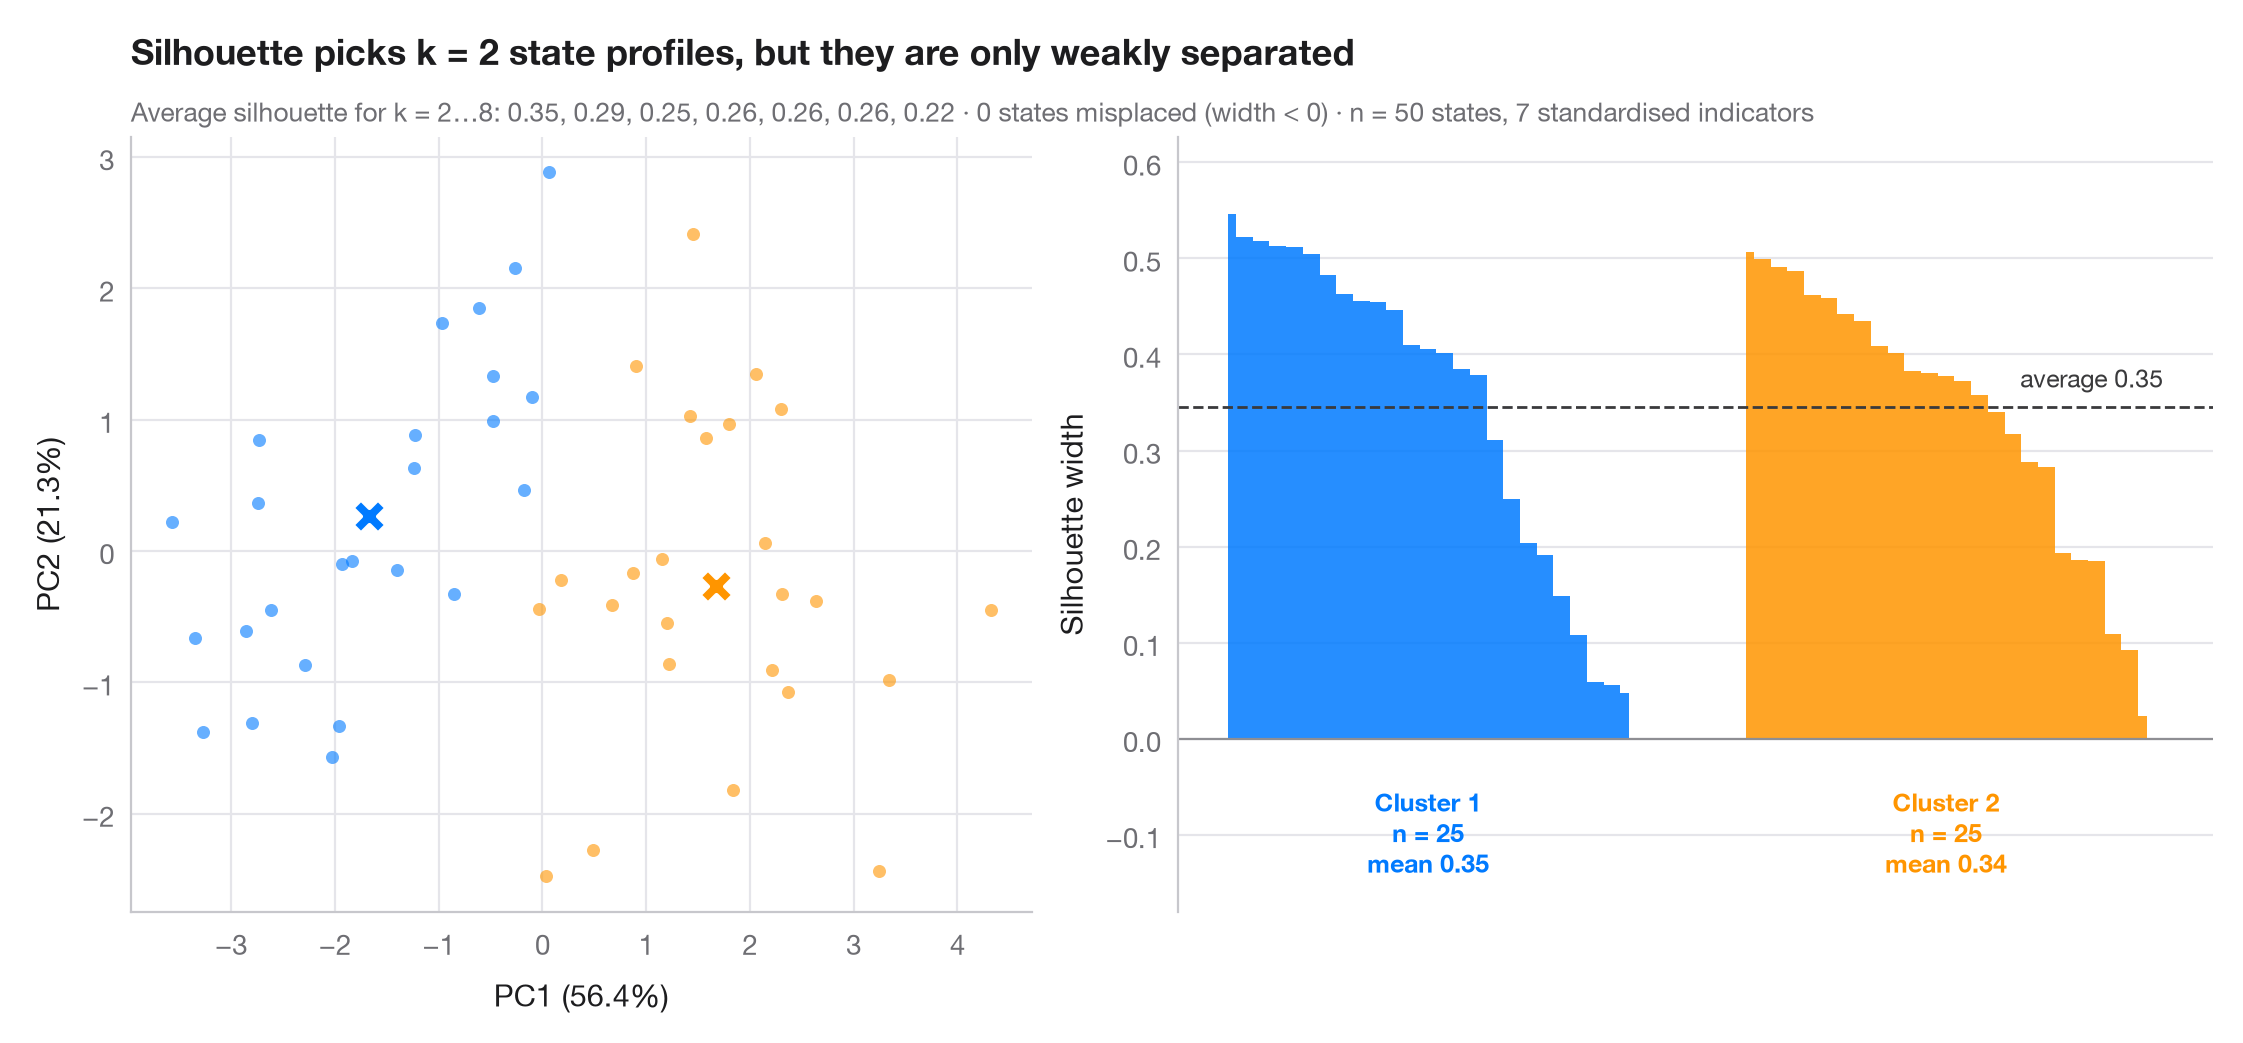
轮廓宽度比较每个观测与其所属簇的接近程度和与最近的其他簇的接近程度:接近 1 表示归属恰当,接近 0 表示处于边界,为负则可能被错分。簇数 k 取平均轮廓宽度最大的值(尝试 2 到 8)。左图在前两个主成分上展示各簇;右图将每个簇内的轮廓宽度排序,虚线为总体平均值。
数据为 statsmodels statecrime 数据集中的美国 50 个州(2009 年数据),用 7 项标准化指标描述:暴力犯罪率和谋杀率、高中毕业生比例、贫困人口比例、单亲家庭比例、白人比例和城市人口比例。哥伦比亚特区被排除在外:它过于极端,k-means 会单独为它分出一个簇。得到的两个簇大致对应犯罪和贫困较低的类型与犯罪和贫困较高的类型,但按照 Kaufman 和 Rousseeuw 的经验法则(0.26–0.50),约 0.35 的平均轮廓宽度只是一种弱结构:各州更像一个连续体,而非彼此分离的类型。计算由 sklearn 的 KMeans、silhouette_score 和 silhouette_samples 完成;PCA 仅用于绘制各簇。
代码及图中文字均为英文。
import matplotlib.pyplot as plt
import numpy as np
import statsmodels.api as sm
from sklearn.cluster import KMeans
from sklearn.decomposition import PCA
from sklearn.metrics import silhouette_samples, silhouette_score
from sklearn.preprocessing import StandardScaler

# 7 social indicators of the 50 US states (DC, an extreme outlier, is left out)
df = sm.datasets.statecrime.load_pandas().data.drop("District of Columbia")
X = StandardScaler().fit_transform(df)

# Choose k by the average silhouette width
fits = {k: KMeans(k, n_init=20, random_state=1).fit(X) for k in range(2, 9)}
avg = {k: silhouette_score(X, m.labels_) for k, m in fits.items()}
k = max(avg, key=avg.get)
labels = fits[k].labels_
sil = silhouette_samples(X, labels)
colors = ["#007AFF", "#FF9500", "#34C759", "#FF3B30", "#AF52DE", "#5AC8FA", "#8E8E93", "#A2845E"]

fig, (ax1, ax2) = plt.subplots(1, 2, figsize=(11, 5), width_ratios=[1, 1.15])

# Left: clusters projected on the first two principal components
pca = PCA(2).fit(X)
S, C = pca.transform(X), pca.transform(fits[k].cluster_centers_)
for j in range(k):
    ax1.scatter(*S[labels == j].T, s=22, color=colors[j], alpha=0.6, lw=0)
    ax1.scatter(*C[j], s=150, marker="X", color=colors[j], edgecolor="white", lw=1.5, zorder=3)
ax1.set_xlabel(f"PC1 ({100 * pca.explained_variance_ratio_[0]:.1f}%)")
ax1.set_ylabel(f"PC2 ({100 * pca.explained_variance_ratio_[1]:.1f}%)")
ax1.grid(axis="x")

# Right: silhouette widths, sorted within cluster
start = 0
for j in range(k):
    s = np.sort(sil[labels == j])[::-1]
    x = np.arange(start, start + len(s))
    ax2.fill_between(x, 0, s, color=colors[j], step="mid", lw=0, alpha=0.85)
    ax2.text(x.mean(), -0.05, f"Cluster {j + 1}\nn = {len(s)}\nmean {s.mean():.2f}",
             ha="center", va="top", fontsize=9, color=colors[j], fontweight="semibold")
    start += len(s) + 6
ax2.axhline(avg[k], color="#3A3A3C", ls="--", lw=1)
ax2.text(start - 6, avg[k] + 0.015, f"average {avg[k]:.2f}", ha="right", va="bottom",
         fontsize=9, color="#3A3A3C")
ax2.axhline(0, color="#8E8E93", lw=0.8)
ax2.set_xticks([])
ax2.set_xlim(-3, start - 3)
ax2.set_ylim(-0.18, max(sil) + 0.08)
ax2.set_ylabel("Silhouette width")
ax2.spines["bottom"].set_visible(False)

ax1.set_title(f"Silhouette picks k = {k} state profiles, but they are only weakly separated",
              pad=26)
ax1.text(0, 1.02, "Average silhouette for k = 2…8: " + ", ".join(f"{v:.2f}" for v in avg.values())
         + f" · {(sil < 0).sum()} states misplaced (width < 0) · n = {len(X)} states, "
         f"{X.shape[1]} standardised indicators", transform=ax1.transAxes, fontsize=9.5,
         color="#6E6E73", in_layout=False)
plt.show()
图表使用了可选的 PyStatlas 样式:添加 plt.style.use("pystatlas.mplstyle") 即可完全还原其外观。
数据来源
- US state crime and social indicators, 2009. U.S. Census Bureau. Statistical Abstract of the United States, state tables for 2009 (crime rates from the FBI Uniform Crime Reporting program). https://www.statsmodels.org/stable/datasets/generated/statecrime.html
Compiled for statsmodels (sm.datasets.statecrime); public domain. See the statsmodels page for each variable's table and footnotes.
这些示例用于说明统计方法。图表标题描述的是该图在这些特定数据中呈现的内容——这些数据往往样本较小、年代较早或并不完整——而不是作者对实质问题的立场。关于解释、背景和数据质量,请以此处引用的原始来源为准。
如何引用
PyStatlas 由 Thierry Warin 创建并维护。如果它对你的工作有所帮助,敬请引用。
Warin, T. (2026). Silhouette plot for k-means. In PyStatlas: A Python Gallery of Statistical Graphics for the Social Sciences. https://warint.github.io/pystatlas/multivariate/silhouette-clusters/
@misc{warin2026statlas,
  author       = {Warin, Thierry},
  title        = {PyStatlas: A Python Gallery of Statistical Graphics for the Social Sciences},
  year         = {2026},
  howpublished = {\url{https://warint.github.io/pystatlas/}},
  note         = {Source code: https://github.com/warint/pystatlas}
}