k-means のシルエットプロット
米国の州ははっきり異なる社会的プロファイルに分かれるか?k-means のクラスターとシルエット幅。
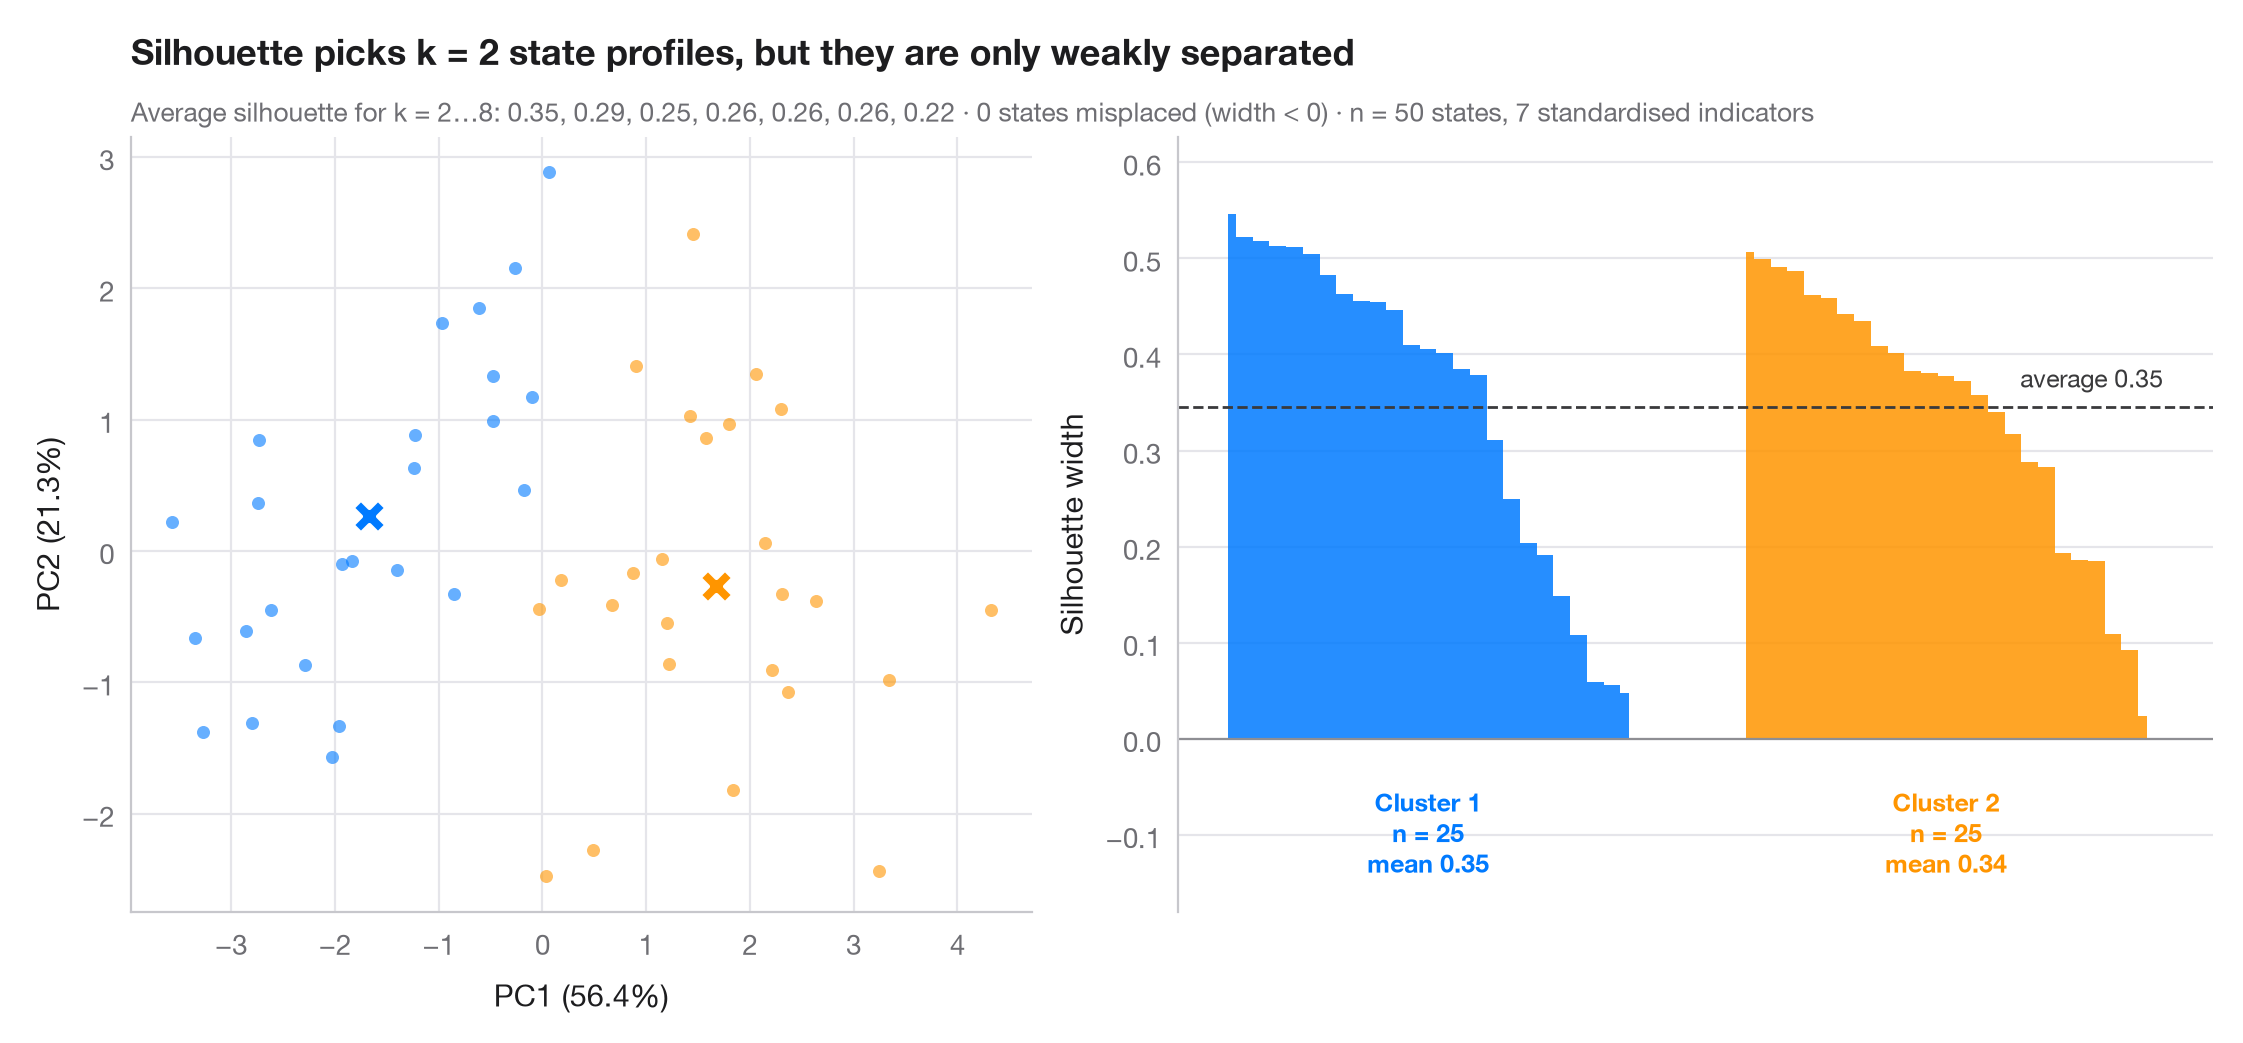
シルエット幅は、各観測が自分のクラスターにどれだけ近いかを、最も近い他のクラスターへの近さと比べた指標です。1 に近ければ適切に配置され、0 に近ければ境界上にあり、負であれば誤って割り当てられている可能性が高いことを示します。クラスター数 k は、平均シルエットが最大となる値を選びます(2〜8 を試行)。左のパネルは第 1・第 2 主成分上のクラスター、右のパネルはクラスター内でシルエット幅を並べ替えたもので、破線は全体の平均です。
データは statsmodels の statecrime データセット(2009 年の数値)に含まれる米国 50 州で、7 つの標準化された指標 — 暴力犯罪率と殺人率、高校卒業者の割合、貧困層の割合、ひとり親世帯の割合、白人の割合、都市人口の割合 — で記述されます。コロンビア特別区は除外しています。極端すぎて k-means が単独のクラスターを割り当ててしまうためです。得られた 2 つのクラスターは、おおむね犯罪と貧困が少ないプロファイルと多いプロファイルに対応しますが、平均シルエット約 0.35 は Kaufman と Rousseeuw の経験則(0.26〜0.50)では弱い構造です。州は別々の類型というより連続体をなしています。処理は sklearn の KMeans、silhouette_score、silhouette_samples が行い、PCA はクラスターの描画にのみ使います。
コードおよび図中のテキストは英語です。
import matplotlib.pyplot as plt
import numpy as np
import statsmodels.api as sm
from sklearn.cluster import KMeans
from sklearn.decomposition import PCA
from sklearn.metrics import silhouette_samples, silhouette_score
from sklearn.preprocessing import StandardScaler

# 7 social indicators of the 50 US states (DC, an extreme outlier, is left out)
df = sm.datasets.statecrime.load_pandas().data.drop("District of Columbia")
X = StandardScaler().fit_transform(df)

# Choose k by the average silhouette width
fits = {k: KMeans(k, n_init=20, random_state=1).fit(X) for k in range(2, 9)}
avg = {k: silhouette_score(X, m.labels_) for k, m in fits.items()}
k = max(avg, key=avg.get)
labels = fits[k].labels_
sil = silhouette_samples(X, labels)
colors = ["#007AFF", "#FF9500", "#34C759", "#FF3B30", "#AF52DE", "#5AC8FA", "#8E8E93", "#A2845E"]

fig, (ax1, ax2) = plt.subplots(1, 2, figsize=(11, 5), width_ratios=[1, 1.15])

# Left: clusters projected on the first two principal components
pca = PCA(2).fit(X)
S, C = pca.transform(X), pca.transform(fits[k].cluster_centers_)
for j in range(k):
    ax1.scatter(*S[labels == j].T, s=22, color=colors[j], alpha=0.6, lw=0)
    ax1.scatter(*C[j], s=150, marker="X", color=colors[j], edgecolor="white", lw=1.5, zorder=3)
ax1.set_xlabel(f"PC1 ({100 * pca.explained_variance_ratio_[0]:.1f}%)")
ax1.set_ylabel(f"PC2 ({100 * pca.explained_variance_ratio_[1]:.1f}%)")
ax1.grid(axis="x")

# Right: silhouette widths, sorted within cluster
start = 0
for j in range(k):
    s = np.sort(sil[labels == j])[::-1]
    x = np.arange(start, start + len(s))
    ax2.fill_between(x, 0, s, color=colors[j], step="mid", lw=0, alpha=0.85)
    ax2.text(x.mean(), -0.05, f"Cluster {j + 1}\nn = {len(s)}\nmean {s.mean():.2f}",
             ha="center", va="top", fontsize=9, color=colors[j], fontweight="semibold")
    start += len(s) + 6
ax2.axhline(avg[k], color="#3A3A3C", ls="--", lw=1)
ax2.text(start - 6, avg[k] + 0.015, f"average {avg[k]:.2f}", ha="right", va="bottom",
         fontsize=9, color="#3A3A3C")
ax2.axhline(0, color="#8E8E93", lw=0.8)
ax2.set_xticks([])
ax2.set_xlim(-3, start - 3)
ax2.set_ylim(-0.18, max(sil) + 0.08)
ax2.set_ylabel("Silhouette width")
ax2.spines["bottom"].set_visible(False)

ax1.set_title(f"Silhouette picks k = {k} state profiles, but they are only weakly separated",
              pad=26)
ax1.text(0, 1.02, "Average silhouette for k = 2…8: " + ", ".join(f"{v:.2f}" for v in avg.values())
         + f" · {(sil < 0).sum()} states misplaced (width < 0) · n = {len(X)} states, "
         f"{X.shape[1]} standardised indicators", transform=ax1.transAxes, fontsize=9.5,
         color="#6E6E73", in_layout=False)
plt.show()
図にはオプションの PyStatlas スタイル を使用しています。同じ見た目にするには plt.style.use("pystatlas.mplstyle") を追加してください。
データの出典
- US state crime and social indicators, 2009. U.S. Census Bureau. Statistical Abstract of the United States, state tables for 2009 (crime rates from the FBI Uniform Crime Reporting program). https://www.statsmodels.org/stable/datasets/generated/statecrime.html
Compiled for statsmodels (sm.datasets.statecrime); public domain. See the statsmodels page for each variable's table and footnotes.
これらの例は統計手法を説明するためのものです。図のタイトルは、この特定のデータ(多くは小規模で、古く、部分的な標本)で図が示す内容を述べたものであり、実質的な問いに対する著者の立場ではありません。解釈、背景、データの質については、ここに挙げた元の出典を参照してください。
引用方法
PyStatlas は Thierry Warin が作成・運営しています。研究や業務に役立った場合は、ぜひ引用してください。
Warin, T. (2026). Silhouette plot for k-means. In PyStatlas: A Python Gallery of Statistical Graphics for the Social Sciences. https://warint.github.io/pystatlas/multivariate/silhouette-clusters/
@misc{warin2026statlas,
  author       = {Warin, Thierry},
  title        = {PyStatlas: A Python Gallery of Statistical Graphics for the Social Sciences},
  year         = {2026},
  howpublished = {\url{https://warint.github.io/pystatlas/}},
  note         = {Source code: https://github.com/warint/pystatlas}
}多変量解析とクラスタリングのその他のグラフ
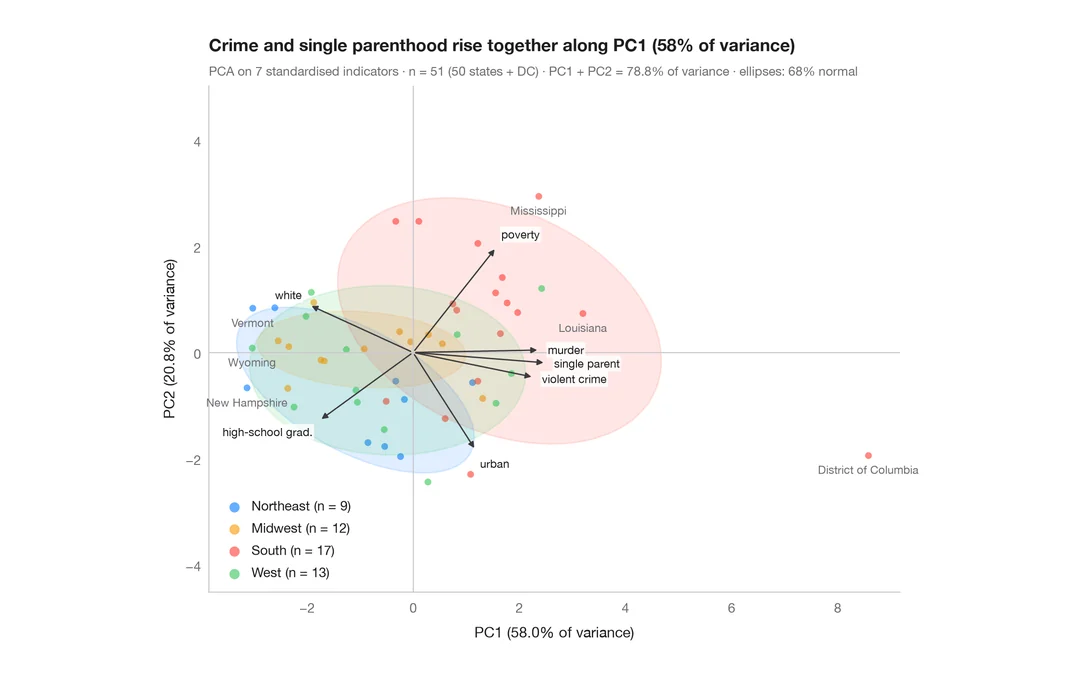
PCA バイプロット
米国の州とその社会指標を第 1・第 2 主成分の平面に配置します。
factoextra::fviz_pca_biplot()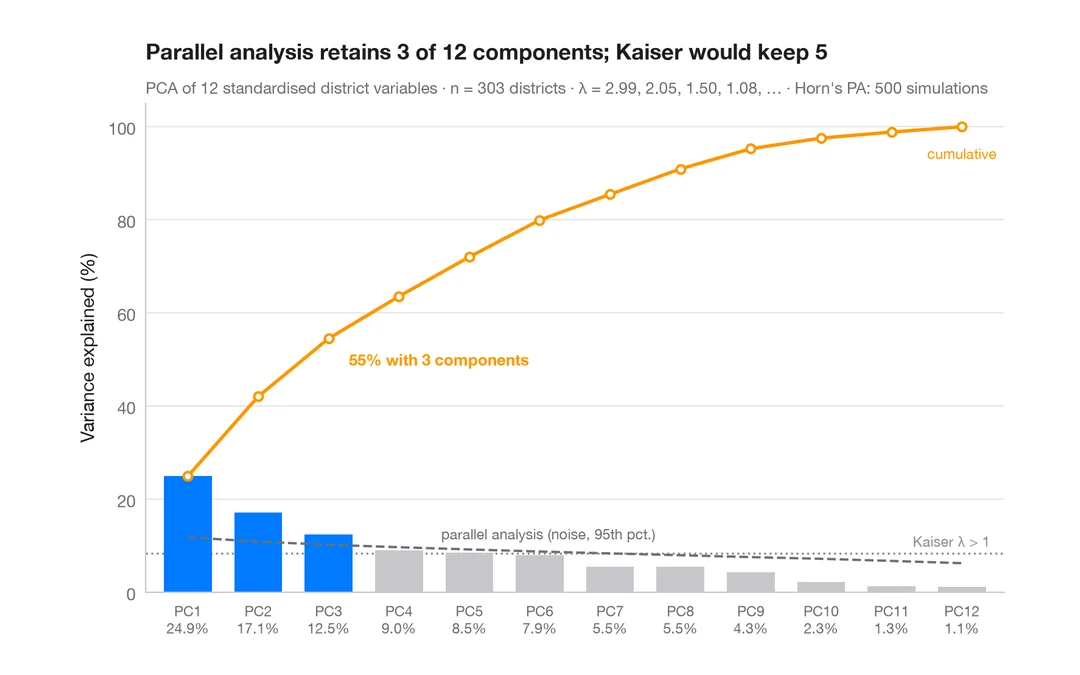
スクリープロット
カリフォルニア州の 303 学区を記述するには何次元が必要か?成分ごとの分散と平行分析による基準。
factoextra::fviz_eig()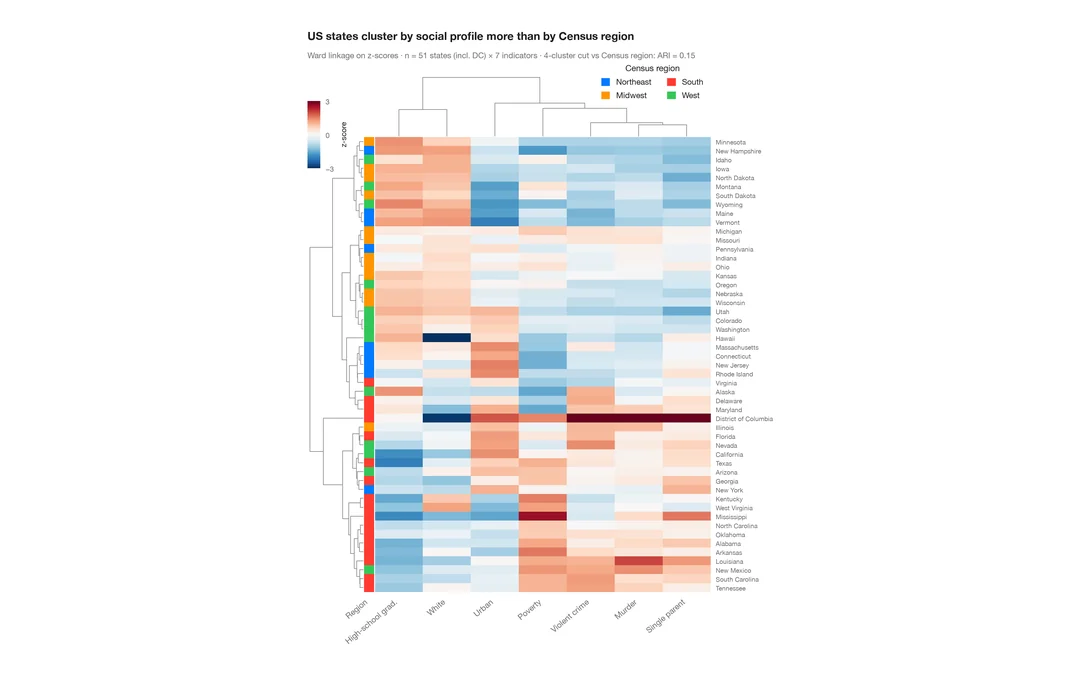
クラスター化ヒートマップ
米国各州の社会指標の z スコアのヒートマップ。行と列のデンドログラム、国勢調査地域のカラーバー付き。
pheatmap::pheatmap() / ComplexHeatmap::Heatmap()