交叉验证模型比较
六个模型预测加利福尼亚州学区数学成绩的逐折 R²,附均值与校正后的 95% 区间。
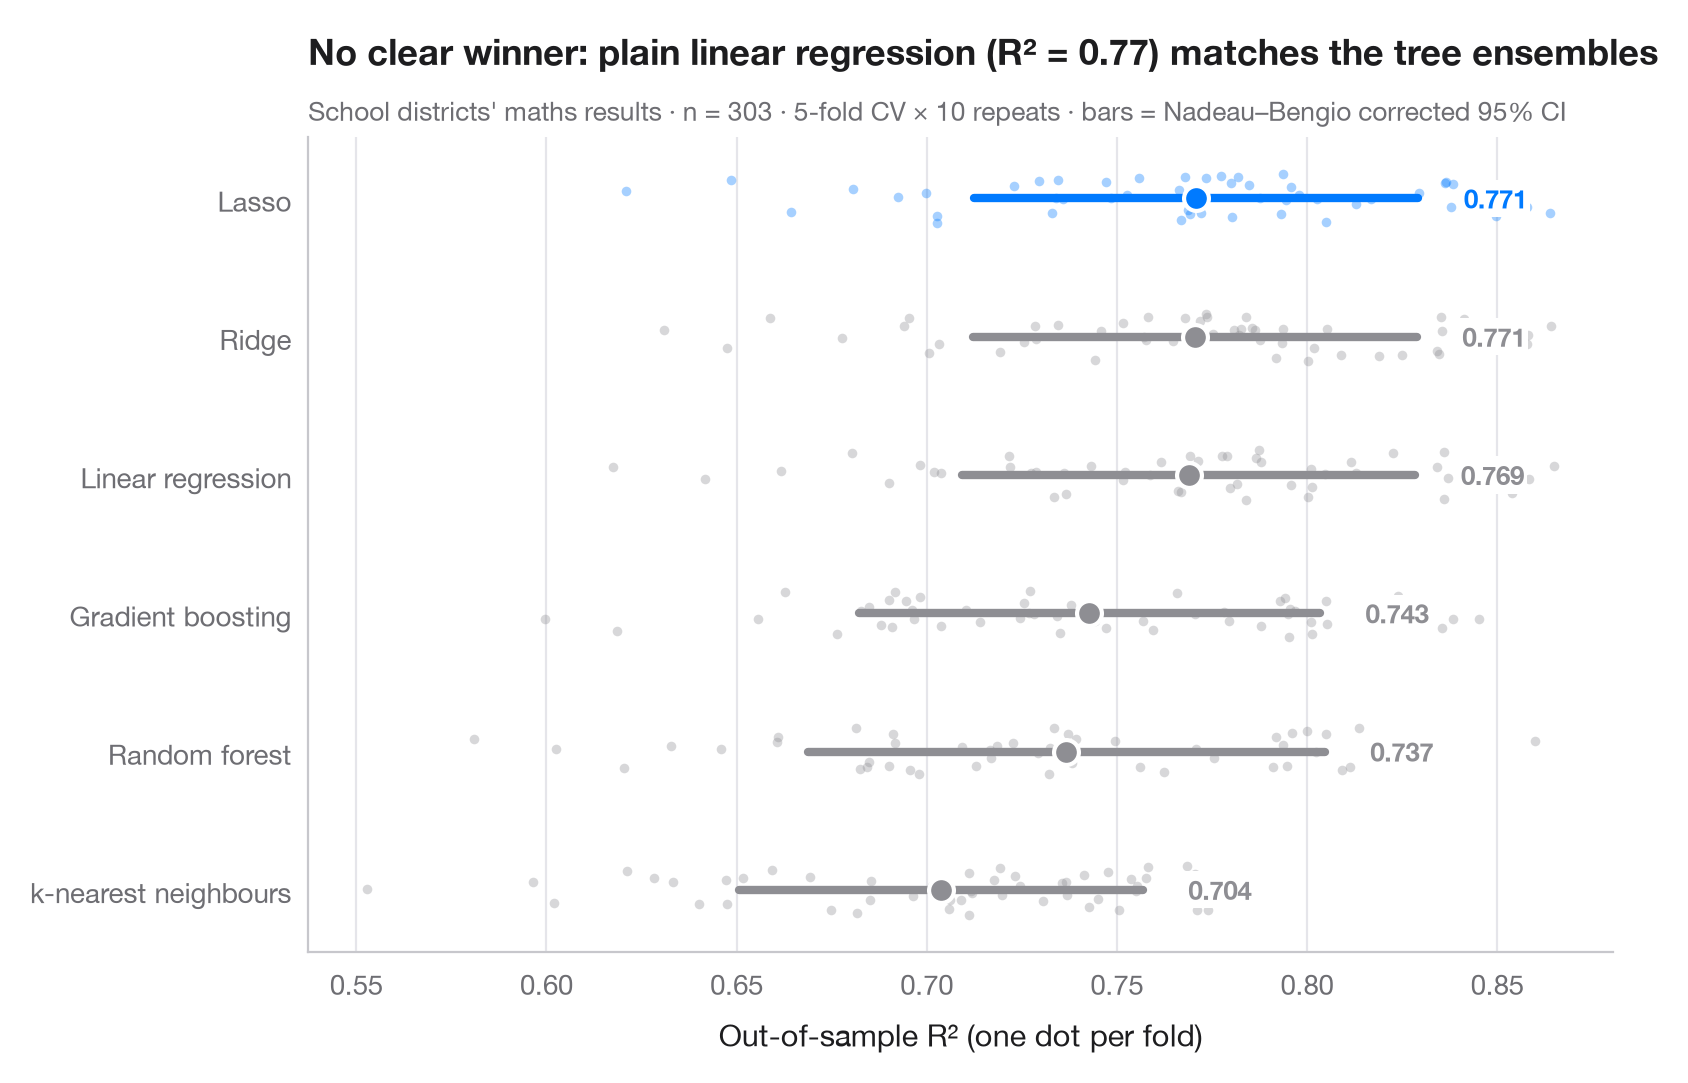
“模型 B 得 0.47,模型 A 得 0.46”——在不知道得分随划分变动多少之前,这句话毫无意义。这里每个模型都在 相同 的 10 × 5 重复折上评估;每个点是一折,大标记为均值,横条为其 95% 区间。各折得分并不独立——训练集相互重叠——因此区间采用 Nadeau–Bengio 校正 方差,而不是过窄的朴素标准误。
数据为 statsmodels 自带的 1998 年 STAR 考试中加利福尼亚州 303 个学区(sm.datasets.star98):结果变量为数学成绩高于全国中位数的学生占比,由学区的十项特征预测(低收入学生占比、族裔构成、教师教龄与薪酬、生均支出、师生比、大学预备课程选修率、全年制学校占比)。得分为样本外 R²。得分来自使用 RepeatedKFold 的 cross_val_score;线性模型在 Pipeline 中做了标准化。这里普通线性回归与树集成模型表现相当:当关系接近可加时,灵活性并无益处。
代码及图中文字均为英文。
import matplotlib.pyplot as plt
import numpy as np
from scipy import stats
import statsmodels.api as sm
from sklearn.ensemble import GradientBoostingRegressor, RandomForestRegressor
from sklearn.linear_model import LassoCV, LinearRegression, RidgeCV
from sklearn.model_selection import RepeatedKFold, cross_val_score
from sklearn.neighbors import KNeighborsRegressor
from sklearn.pipeline import make_pipeline
from sklearn.preprocessing import StandardScaler

# Data: 303 California school districts; outcome = % of students above the national median in maths
d = sm.datasets.star98.load_pandas().data
y = 100 * d["NABOVE"] / (d["NABOVE"] + d["NBELOW"])
names = {"LOWINC": "% low-income students", "PERASIAN": "% Asian students", "PERBLACK": "% Black students",
         "PERHISP": "% Hispanic students", "AVYRSEXP": "Teacher experience (years)",
         "AVSALK": "Teacher salary ($000)", "PERSPENK": "Spending per pupil ($000)",
         "PTRATIO": "Pupils per teacher", "PCTAF": "% in college-prep courses",
         "PCTYRRND": "% year-round schools"}
X = d[list(names)]
k, reps = 5, 10
cv = RepeatedKFold(n_splits=k, n_repeats=reps, random_state=0)
models = {
    "Linear regression": make_pipeline(StandardScaler(), LinearRegression()),
    "Ridge": make_pipeline(StandardScaler(), RidgeCV(alphas=np.logspace(-3, 3, 25))),
    "Lasso": make_pipeline(StandardScaler(), LassoCV(random_state=0)),
    "Random forest": RandomForestRegressor(n_estimators=300, min_samples_leaf=5, random_state=0),
    "Gradient boosting": GradientBoostingRegressor(learning_rate=0.05, max_depth=2, random_state=0),
    "k-nearest neighbours": make_pipeline(StandardScaler(), KNeighborsRegressor(n_neighbors=15)),
}
scores = {name: cross_val_score(m, X, y, cv=cv, scoring="r2", n_jobs=-1) for name, m in models.items()}

# Nadeau–Bengio corrected 95% interval for a mean of k-fold scores
def corrected_ci(s):
    J = len(s)
    se = np.sqrt((1 / J + (1 / k) / (1 - 1 / k)) * s.var(ddof=1))
    t = stats.t.ppf(0.975, J - 1)
    return s.mean() - t * se, s.mean() + t * se

order = sorted(scores, key=lambda n: scores[n].mean())
best = order[-1]
fig, ax = plt.subplots(figsize=(8, 5.2))
rng = np.random.default_rng(3)
for i, name in enumerate(order):
    s = scores[name]
    c = "#007AFF" if name == best else "#8E8E93"
    ax.scatter(s, i + rng.uniform(-0.18, 0.18, len(s)), s=12, color=c, alpha=0.35, lw=0)
    lo, hi = corrected_ci(s)
    ax.plot([lo, hi], [i, i], color=c, lw=3, solid_capstyle="round")
    ax.scatter(s.mean(), i, s=80, color=c, edgecolor="white", lw=1.5, zorder=4)
    ax.text(hi + 0.012, i, f"{s.mean():.3f}", va="center", fontsize=9.5, color=c, fontweight="semibold",
            bbox=dict(fc="white", ec="none", pad=1), zorder=5)
ax.set_yticks(range(len(order)), order)
ax.set_xlabel("Out-of-sample R² (one dot per fold)")
ax.grid(axis="x"); ax.grid(axis="y", visible=False)
lin = scores["Linear regression"].mean()
ax.set_title(f"No clear winner: plain linear regression (R² = {lin:.2f}) matches the tree ensembles", pad=26)
ax.text(0, 1.02, f"School districts' maths results · n = {len(y)} · {k}-fold CV × {reps} repeats · "
        "bars = Nadeau–Bengio corrected 95% CI", transform=ax.transAxes, fontsize=9.5, color="#6E6E73")
plt.show()
图表使用了可选的 PyStatlas 样式:添加 plt.style.use("pystatlas.mplstyle") 即可完全还原其外观。
数据来源
- California STAR test results, 1998 (303 school districts). Gill, J. (2001). Generalized Linear Models: A Unified Approach (Quantitative Applications in the Social Sciences, No. 134). Sage. https://www.statsmodels.org/stable/datasets/generated/star98.html
Original data from the California Department of Education's Standardized Testing and Reporting (STAR) program, 1998. Subset distributed with statsmodels (sm.datasets.star98) with the author's permission.
这些示例用于说明统计方法。图表标题描述的是该图在这些特定数据中呈现的内容——这些数据往往样本较小、年代较早或并不完整——而不是作者对实质问题的立场。关于解释、背景和数据质量,请以此处引用的原始来源为准。
如何引用
PyStatlas 由 Thierry Warin 创建并维护。如果它对你的工作有所帮助,敬请引用。
Warin, T. (2026). Cross-validated model comparison. In PyStatlas: A Python Gallery of Statistical Graphics for the Social Sciences. https://warint.github.io/pystatlas/machine-learning/model-comparison/
@misc{warin2026statlas,
  author       = {Warin, Thierry},
  title        = {PyStatlas: A Python Gallery of Statistical Graphics for the Social Sciences},
  year         = {2026},
  howpublished = {\url{https://warint.github.io/pystatlas/}},
  note         = {Source code: https://github.com/warint/pystatlas}
}