Tukey HSD 区间
所有两两均值差的 95% 联合置信区间。
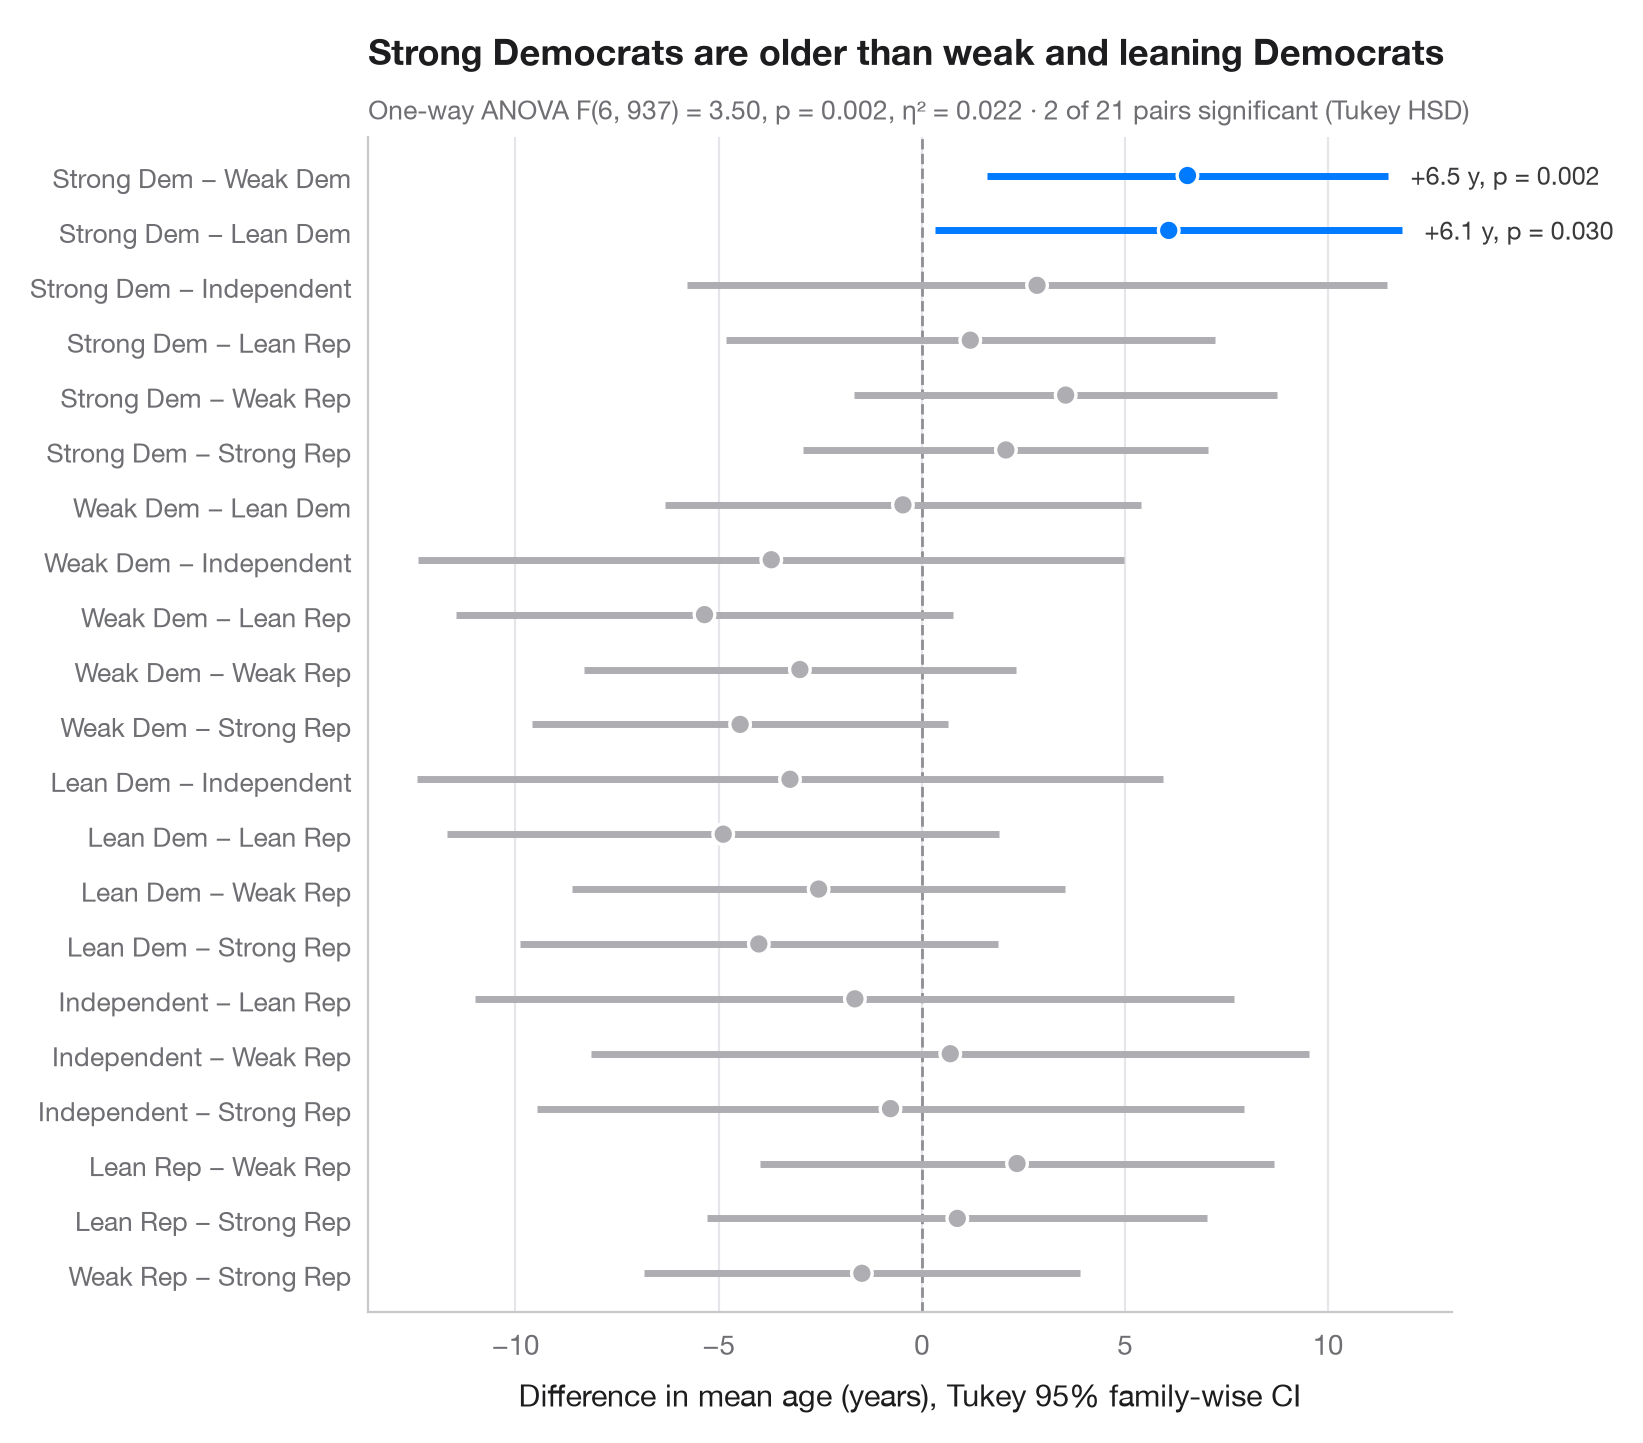
方差分析表明“各组存在差异”之后,Tukey 真实显著差异(HSD)法进一步指出哪些组对之间存在差异。每一行是一组两两均值差,其置信区间经过放宽,使所有区间同时在 95% 水平上成立。不跨过零的区间会被着色:第一组年龄更大时为蓝色,更小时为橙色。
数据为 statsmodels 自带的 1996 年美国全国选举研究中的 944 名受访者(sm.datasets.anes96):按政党认同(从坚定的民主党人到坚定的共和党人)比较年龄。区间由 statsmodels.stats.multicomp.pairwise_tukeyhsd 计算,总体检验由 scipy.stats.f_oneway 完成。
代码及图中文字均为英文。
import matplotlib.pyplot as plt
import numpy as np
import pandas as pd
import statsmodels.api as sm
from scipy import stats
from statsmodels.stats.multicomp import pairwise_tukeyhsd

# Data: age by party identification (0 = strong Democrat ... 6 = strong Republican)
anes = sm.datasets.anes96.load_pandas().data
names = ["Strong Dem", "Weak Dem", "Lean Dem", "Independent",
         "Lean Rep", "Weak Rep", "Strong Rep"]
anes["party"] = pd.Categorical(anes.PID.astype(int).map(dict(enumerate(names))), names)

# One-way ANOVA, then Tukey HSD on all 21 pairs
F, p = stats.f_oneway(*[g.age for _, g in anes.groupby("party", observed=True)])
k, n = len(names), len(anes)
eta2 = F * (k - 1) / (F * (k - 1) + n - k)
tukey = pairwise_tukeyhsd(anes.age, anes.party.cat.codes)
res = pd.DataFrame(tukey._results_table.data[1:], columns=tukey._results_table.data[0])
# statsmodels reports group2 − group1; flip to read "group1 − group2"
res = res.assign(diff=-res.meandiff, low=-res.upper, high=-res.lower,
                 label=[f"{names[a]} − {names[b]}" for a, b in zip(res.group1, res.group2)])
res = res.iloc[::-1].reset_index(drop=True)  # first pair on top

colors = np.where(~res.reject, "#AEAEB2", np.where(res["diff"] > 0, "#007AFF", "#FF9500"))
fig, ax = plt.subplots(figsize=(8, 7))
y = np.arange(len(res))
ax.axvline(0, color="#8E8E93", lw=1, ls="--", zorder=1)
ax.hlines(y, res.low, res.high, color=colors, lw=2.5, zorder=2)
ax.scatter(res["diff"], y, s=55, color=colors, edgecolor="white", lw=1.2, zorder=3)
for yi, row in res[res.reject].iterrows():
    ax.annotate(f"{row['diff']:+.1f} y, p = {row['p-adj']:.3f}", (row.high, yi), xytext=(8, 0),
                textcoords="offset points", va="center", fontsize=9, color="#3A3A3C")

ax.set_yticks(y, res.label, fontsize=9.5)
ax.set_ylim(-0.7, len(res) - 0.3)
ax.grid(axis="x"); ax.grid(axis="y", visible=False)
ax.set_xlabel("Difference in mean age (years), Tukey 95% family-wise CI")
ax.set_title("Strong Democrats are older than weak and leaning Democrats", pad=26)
ax.text(0, 1.015, f"One-way ANOVA F({k - 1}, {n - k}) = {F:.2f}, p = {p:.3f}, η² = {eta2:.3f}"
        f" · {res.reject.sum()} of {len(res)} pairs significant (Tukey HSD)",
        transform=ax.transAxes, fontsize=9.5, color="#6E6E73")
plt.show()
图表使用了可选的 PyStatlas 样式:添加 plt.style.use("pystatlas.mplstyle") 即可完全还原其外观。
数据来源
- American National Election Study, 1996. Rosenstone, S. J., Kinder, D. R., Miller, W. E., & the National Election Studies. (2016). ANES 1996 Time Series Study (ICPSR 6896; Version 6) [Data set]. Inter-university Consortium for Political and Social Research. https://doi.org/10.3886/ICPSR06896.v6
Subset of 944 respondents distributed with statsmodels (sm.datasets.anes96); public domain.
这些示例用于说明统计方法。图表标题描述的是该图在这些特定数据中呈现的内容——这些数据往往样本较小、年代较早或并不完整——而不是作者对实质问题的立场。关于解释、背景和数据质量,请以此处引用的原始来源为准。
如何引用
PyStatlas 由 Thierry Warin 创建并维护。如果它对你的工作有所帮助,敬请引用。
Warin, T. (2026). Tukey HSD intervals. In PyStatlas: A Python Gallery of Statistical Graphics for the Social Sciences. https://warint.github.io/pystatlas/group-comparisons/tukey-hsd/
@misc{warin2026statlas,
  author       = {Warin, Thierry},
  title        = {PyStatlas: A Python Gallery of Statistical Graphics for the Social Sciences},
  year         = {2026},
  howpublished = {\url{https://warint.github.io/pystatlas/}},
  note         = {Source code: https://github.com/warint/pystatlas}
}