Tukey HSD intervals
Simultaneous 95% confidence intervals for every pairwise difference in means.
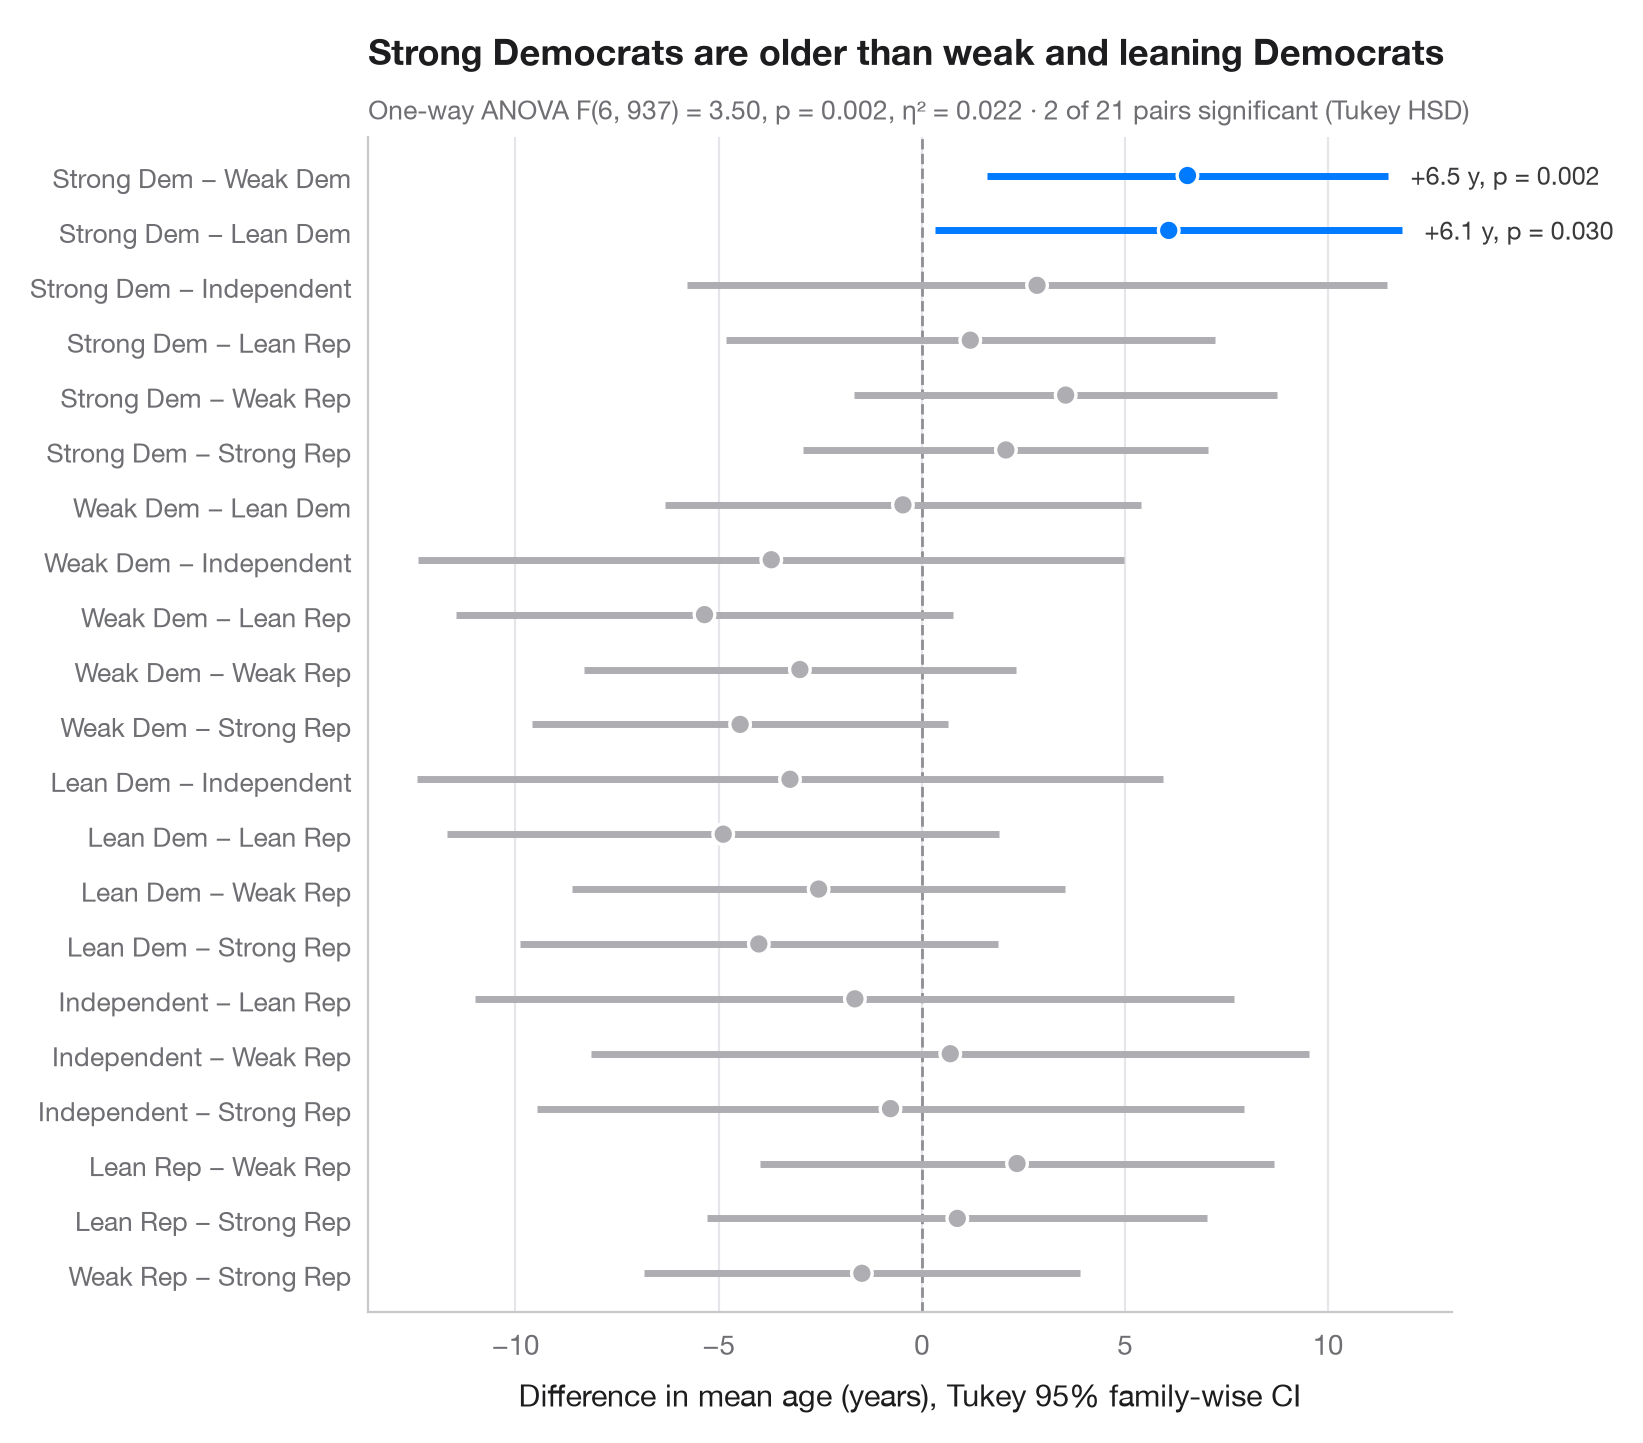
After an ANOVA says "the groups differ", Tukey's honestly significant difference (HSD) says which pairs differ. Each row is one pairwise difference in means with a confidence interval that is widened so that all intervals hold simultaneously at 95%. Intervals that do not cross zero are coloured: blue when the first group is older, orange when it is younger.
Data are 944 respondents of the 1996 American National Election Study
bundled with statsmodels (sm.datasets.anes96): age by party
identification, from strong Democrat to strong Republican. The intervals come
from statsmodels.stats.multicomp.pairwise_tukeyhsd, the omnibus test from
scipy.stats.f_oneway.
import matplotlib.pyplot as plt
import numpy as np
import pandas as pd
import statsmodels.api as sm
from scipy import stats
from statsmodels.stats.multicomp import pairwise_tukeyhsd

# Data: age by party identification (0 = strong Democrat ... 6 = strong Republican)
anes = sm.datasets.anes96.load_pandas().data
names = ["Strong Dem", "Weak Dem", "Lean Dem", "Independent",
         "Lean Rep", "Weak Rep", "Strong Rep"]
anes["party"] = pd.Categorical(anes.PID.astype(int).map(dict(enumerate(names))), names)

# One-way ANOVA, then Tukey HSD on all 21 pairs
F, p = stats.f_oneway(*[g.age for _, g in anes.groupby("party", observed=True)])
k, n = len(names), len(anes)
eta2 = F * (k - 1) / (F * (k - 1) + n - k)
tukey = pairwise_tukeyhsd(anes.age, anes.party.cat.codes)
res = pd.DataFrame(tukey._results_table.data[1:], columns=tukey._results_table.data[0])
# statsmodels reports group2 − group1; flip to read "group1 − group2"
res = res.assign(diff=-res.meandiff, low=-res.upper, high=-res.lower,
                 label=[f"{names[a]} − {names[b]}" for a, b in zip(res.group1, res.group2)])
res = res.iloc[::-1].reset_index(drop=True)  # first pair on top

colors = np.where(~res.reject, "#AEAEB2", np.where(res["diff"] > 0, "#007AFF", "#FF9500"))
fig, ax = plt.subplots(figsize=(8, 7))
y = np.arange(len(res))
ax.axvline(0, color="#8E8E93", lw=1, ls="--", zorder=1)
ax.hlines(y, res.low, res.high, color=colors, lw=2.5, zorder=2)
ax.scatter(res["diff"], y, s=55, color=colors, edgecolor="white", lw=1.2, zorder=3)
for yi, row in res[res.reject].iterrows():
    ax.annotate(f"{row['diff']:+.1f} y, p = {row['p-adj']:.3f}", (row.high, yi), xytext=(8, 0),
                textcoords="offset points", va="center", fontsize=9, color="#3A3A3C")

ax.set_yticks(y, res.label, fontsize=9.5)
ax.set_ylim(-0.7, len(res) - 0.3)
ax.grid(axis="x"); ax.grid(axis="y", visible=False)
ax.set_xlabel("Difference in mean age (years), Tukey 95% family-wise CI")
ax.set_title("Strong Democrats are older than weak and leaning Democrats", pad=26)
ax.text(0, 1.015, f"One-way ANOVA F({k - 1}, {n - k}) = {F:.2f}, p = {p:.3f}, η² = {eta2:.3f}"
        f" · {res.reject.sum()} of {len(res)} pairs significant (Tukey HSD)",
        transform=ax.transAxes, fontsize=9.5, color="#6E6E73")
plt.show()
Figures use the optional PyStatlas style: add plt.style.use("pystatlas.mplstyle") to match the look exactly.
Data source
- American National Election Study, 1996. Rosenstone, S. J., Kinder, D. R., Miller, W. E., & the National Election Studies. (2016). ANES 1996 Time Series Study (ICPSR 6896; Version 6) [Data set]. Inter-university Consortium for Political and Social Research. https://doi.org/10.3886/ICPSR06896.v6
Subset of 944 respondents distributed with statsmodels (sm.datasets.anes96); public domain.
The examples illustrate statistical methods. Their titles describe what each figure shows in these particular data — often a small, dated or partial sample — not the author's position on the substantive question. For interpretation, context and data quality, rely on the original sources cited here.
How to cite
PyStatlas is created and maintained by Thierry Warin. If it helped your work, please cite it.
Warin, T. (2026). Tukey HSD intervals. In PyStatlas: A Python Gallery of Statistical Graphics for the Social Sciences. https://warint.github.io/pystatlas/group-comparisons/tukey-hsd/
@misc{warin2026statlas,
  author       = {Warin, Thierry},
  title        = {PyStatlas: A Python Gallery of Statistical Graphics for the Social Sciences},
  year         = {2026},
  howpublished = {\url{https://warint.github.io/pystatlas/}},
  note         = {Source code: https://github.com/warint/pystatlas}
}More in Group comparisons
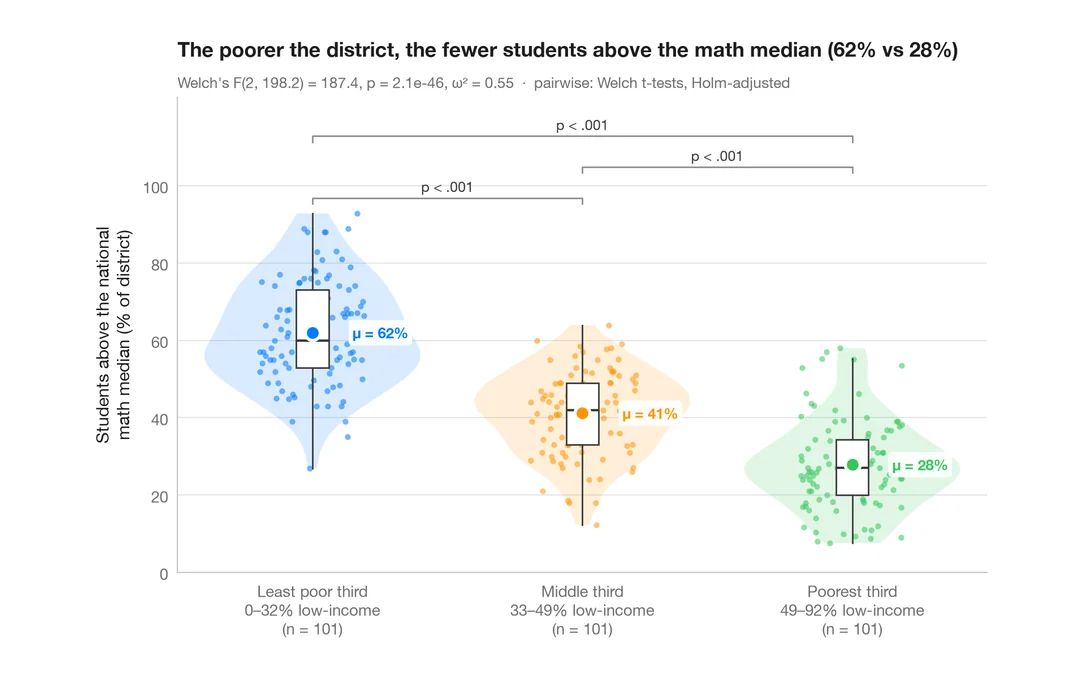
Between-groups comparison
Violin + box + points with Welch's ANOVA, effect size and pairwise tests.
ggstatsplot::ggbetweenstats()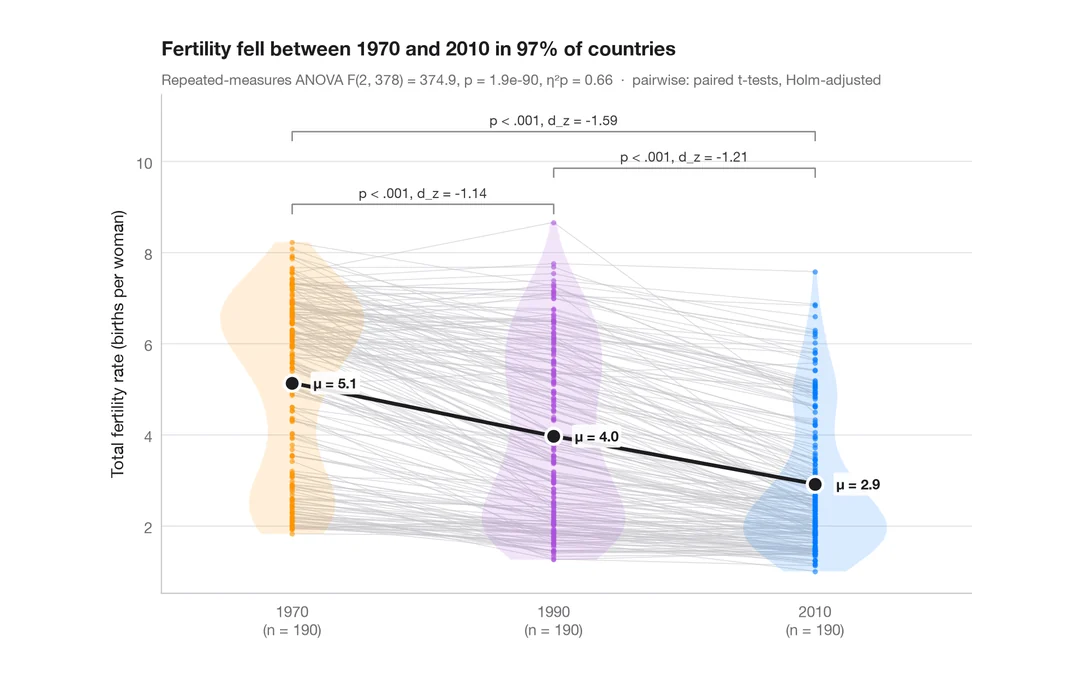
Within-subjects comparison
Repeated measures with one line per subject, means, rm-ANOVA and paired tests.
ggstatsplot::ggwithinstats()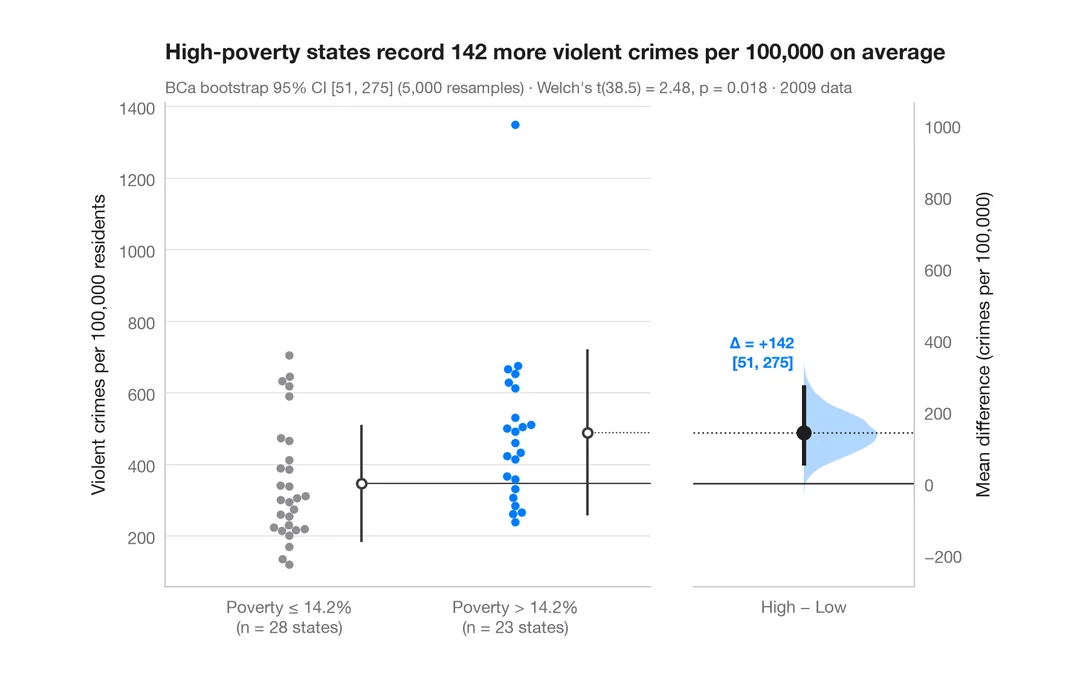
Estimation plot
Raw data of two groups plus the mean difference and its bootstrap 95% CI.
dabestr::dabest() + plot()