Between-groups comparison
Violin + box + points with Welch's ANOVA, effect size and pairwise tests.
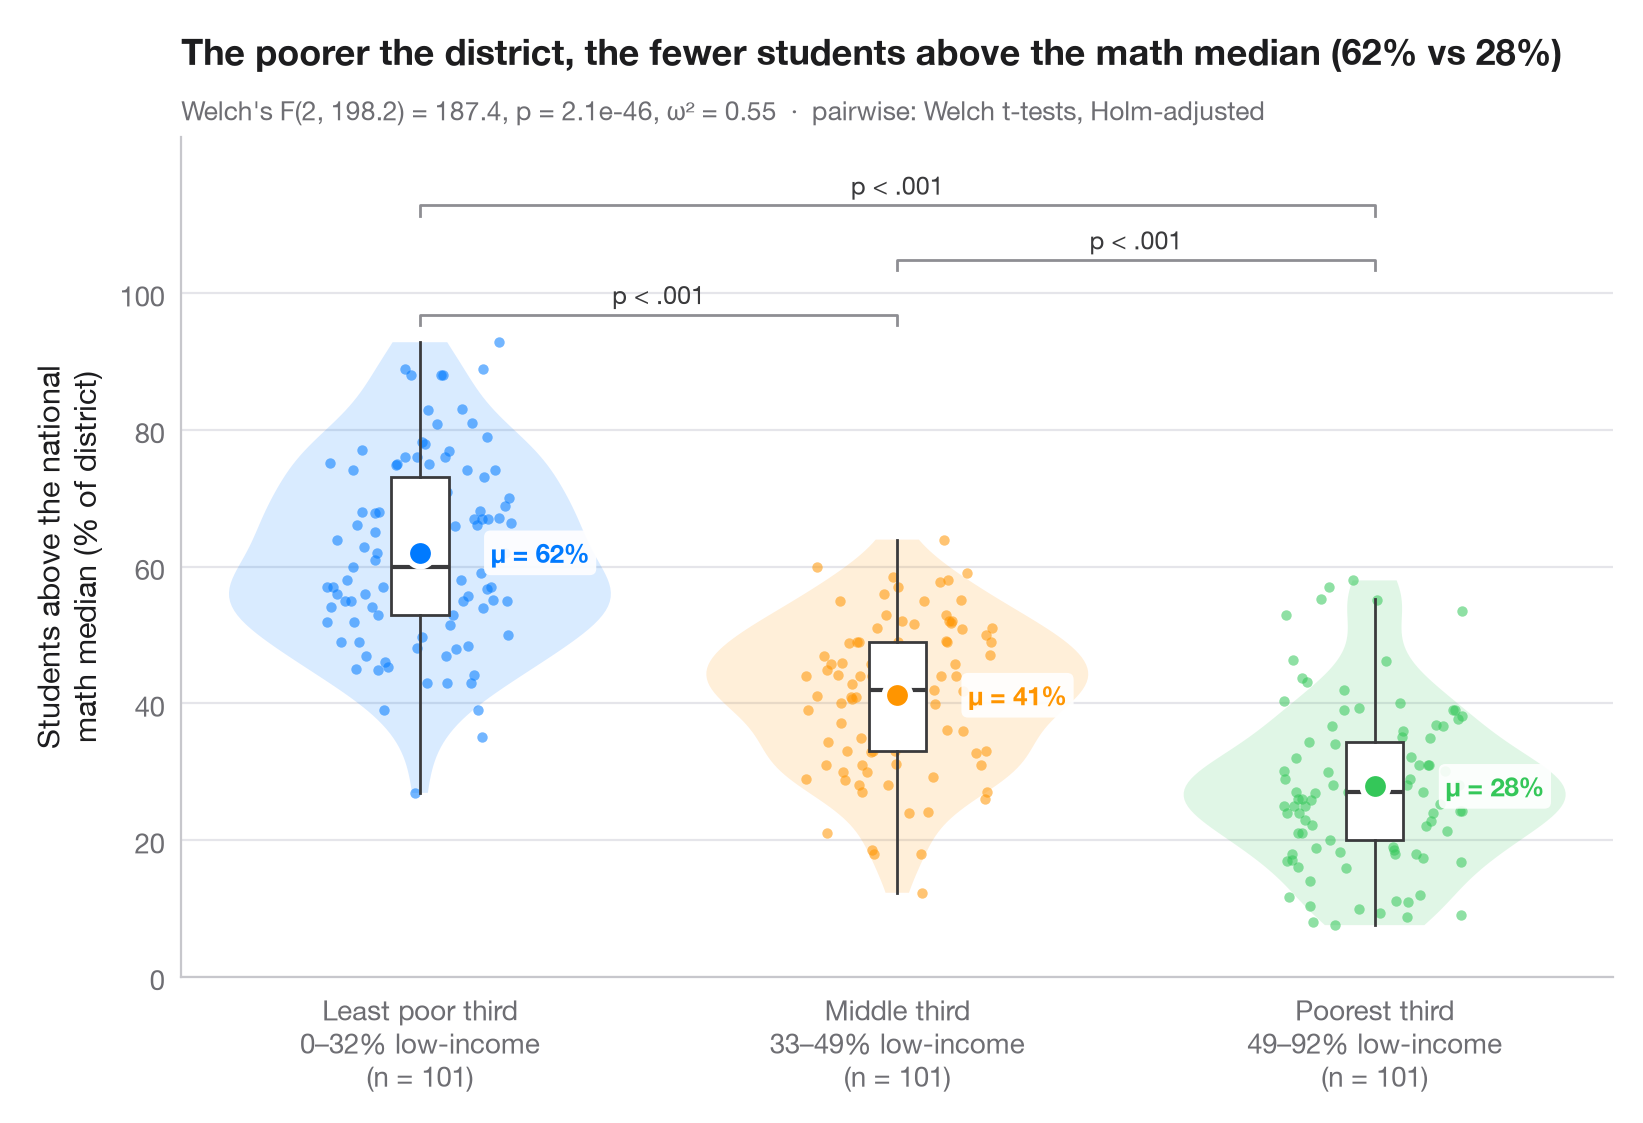
The Python counterpart of ggbetweenstats(): every observation is shown,
wrapped in a violin (distribution) and a slim box (quartiles), with the group
mean highlighted. The subtitle reports Welch's one-way ANOVA — robust to
unequal variances — together with ω² as effect size, and brackets show the
Holm-corrected pairwise Welch t-tests.
Data are the 303 California school districts of the 1998 STAR test bundled
with statsmodels (sm.datasets.star98). The outcome is the share of
students scoring above the national median in mathematics,
NABOVE / (NABOVE + NBELOW), and the groups are terciles of the percentage
of low-income students in the district (LOWINC), cut with pandas.qcut
into three groups of 101 districts.
from itertools import combinations

import matplotlib.pyplot as plt
import numpy as np
import pandas as pd
import statsmodels.api as sm
from scipy import stats
from statsmodels.stats.multitest import multipletests
from statsmodels.stats.oneway import anova_oneway

# Data: % of students above the national math median, by district low-income tercile
df = sm.datasets.star98.load_pandas().data
df["above"] = 100 * df.NABOVE / (df.NABOVE + df.NBELOW)
groups = ["Least poor third", "Middle third", "Poorest third"]
df["poverty"] = pd.qcut(df.LOWINC, 3, labels=groups)
data = [df.loc[df.poverty == g, "above"].to_numpy() for g in groups]
palette = ["#007AFF", "#FF9500", "#34C759"]

# Welch's ANOVA + omega squared
res = anova_oneway(data, use_var="unequal")
k, n = len(data), sum(len(d) for d in data)
omega2 = (res.statistic - 1) * (k - 1) / ((res.statistic - 1) * (k - 1) + n)

# Pairwise Welch t-tests, Holm-corrected
pairs = list(combinations(range(k), 2))
raw_p = [stats.ttest_ind(data[i], data[j], equal_var=False).pvalue for i, j in pairs]
adj_p = multipletests(raw_p, method="holm")[1]

fig, ax = plt.subplots(figsize=(8, 5.4))
rng = np.random.default_rng(1)
for i, (d, c) in enumerate(zip(data, palette)):
    v = ax.violinplot(d, positions=[i], widths=0.8, showextrema=False)
    for body in v["bodies"]:
        body.set(facecolor=c, alpha=0.15, edgecolor="none")
    ax.boxplot(d, positions=[i], widths=0.12, showfliers=False, patch_artist=True,
               boxprops=dict(facecolor="white", edgecolor="#3A3A3C", lw=1),
               medianprops=dict(color="#3A3A3C", lw=1.5),
               whiskerprops=dict(color="#3A3A3C"), capprops=dict(visible=False))
    ax.scatter(i + rng.uniform(-0.22, 0.22, len(d)) * 0.9, d, s=14, color=c, alpha=0.55, lw=0)
    ax.scatter(i, d.mean(), s=90, color=c, edgecolor="white", lw=2, zorder=5)
    ax.annotate(f"μ = {d.mean():.0f}%", (i + 0.09, d.mean()), xytext=(10, 0), textcoords="offset points",
                va="center", bbox=dict(boxstyle="round,pad=0.25", fc="white", ec="none", alpha=0.9), fontsize=9.5, fontweight="semibold", color=c)

# Significance brackets
top, step = max(map(np.max, data)), 8
for h, ((i, j), p) in enumerate(sorted(zip(pairs, adj_p), key=lambda t: t[0][1] - t[0][0])):
    y = top + 4 + h * step
    ax.plot([i, i, j, j], [y - 1.5, y, y, y - 1.5], color="#8E8E93", lw=1)
    label = "p < .001" if p < 0.001 else f"p = {p:.3f}"
    ax.text((i + j) / 2, y + 0.8, label, ha="center", va="bottom", fontsize=9, color="#3A3A3C")

lowinc = df.groupby("poverty", observed=True).LOWINC.agg(["min", "max"])
ax.set_xticks(range(k), [f"{g}\n{lowinc.loc[g, 'min']:.0f}–{lowinc.loc[g, 'max']:.0f}% low-income"
                         f"\n(n = {len(d)})" for g, d in zip(groups, data)])
ax.set_ylabel("Students above the national\nmath median (% of district)")
ax.set_ylim(top=top + 4 + len(pairs) * step + 2)
ax.set_yticks(range(0, 101, 20))
ax.set_title(f"The poorer the district, the fewer students above the math median "
             f"({data[0].mean():.0f}% vs {data[-1].mean():.0f}%)", pad=26)
ax.text(0, 1.02, f"Welch's F({res.df_num:.0f}, {res.df_denom:.1f}) = {res.statistic:.1f}, "
        f"p = {res.pvalue:.1e}, ω² = {omega2:.2f}  ·  pairwise: Welch t-tests, Holm-adjusted",
        transform=ax.transAxes, fontsize=9.5, color="#6E6E73")
plt.show()
Figures use the optional PyStatlas style: add plt.style.use("pystatlas.mplstyle") to match the look exactly.
Data source
- California STAR test results, 1998 (303 school districts). Gill, J. (2001). Generalized Linear Models: A Unified Approach (Quantitative Applications in the Social Sciences, No. 134). Sage. https://www.statsmodels.org/stable/datasets/generated/star98.html
Original data from the California Department of Education's Standardized Testing and Reporting (STAR) program, 1998. Subset distributed with statsmodels (sm.datasets.star98) with the author's permission.
The examples illustrate statistical methods. Their titles describe what each figure shows in these particular data — often a small, dated or partial sample — not the author's position on the substantive question. For interpretation, context and data quality, rely on the original sources cited here.
How to cite
PyStatlas is created and maintained by Thierry Warin. If it helped your work, please cite it.
Warin, T. (2026). Between-groups comparison. In PyStatlas: A Python Gallery of Statistical Graphics for the Social Sciences. https://warint.github.io/pystatlas/group-comparisons/between-groups-violin/
@misc{warin2026statlas,
  author       = {Warin, Thierry},
  title        = {PyStatlas: A Python Gallery of Statistical Graphics for the Social Sciences},
  year         = {2026},
  howpublished = {\url{https://warint.github.io/pystatlas/}},
  note         = {Source code: https://github.com/warint/pystatlas}
}More in Group comparisons
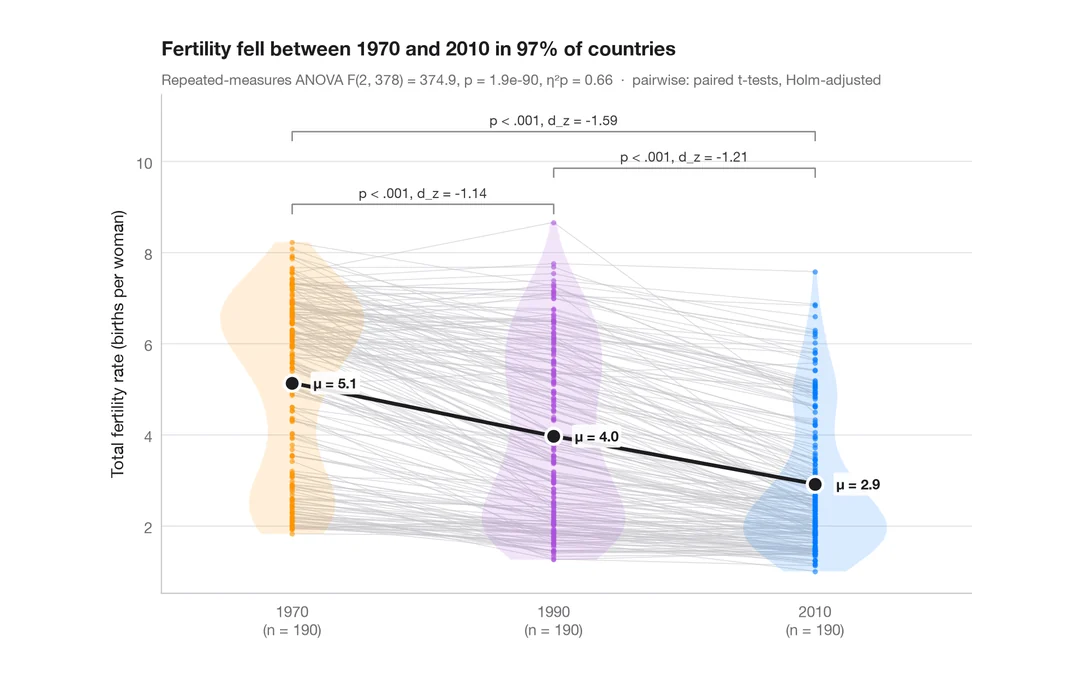
Within-subjects comparison
Repeated measures with one line per subject, means, rm-ANOVA and paired tests.
ggstatsplot::ggwithinstats()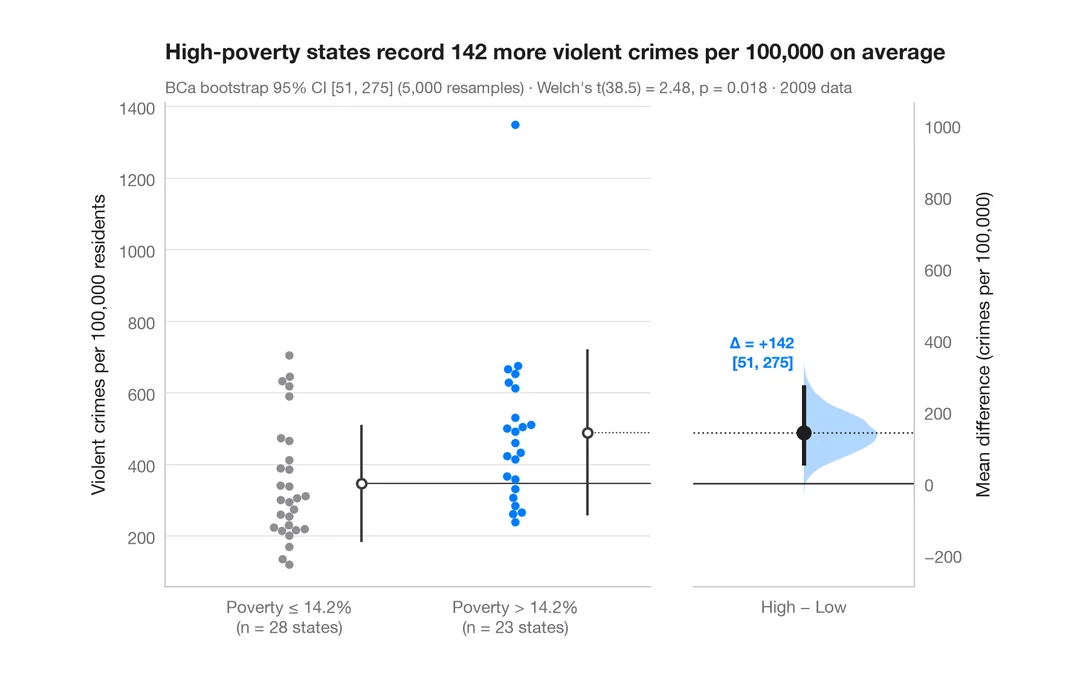
Estimation plot
Raw data of two groups plus the mean difference and its bootstrap 95% CI.
dabestr::dabest() + plot()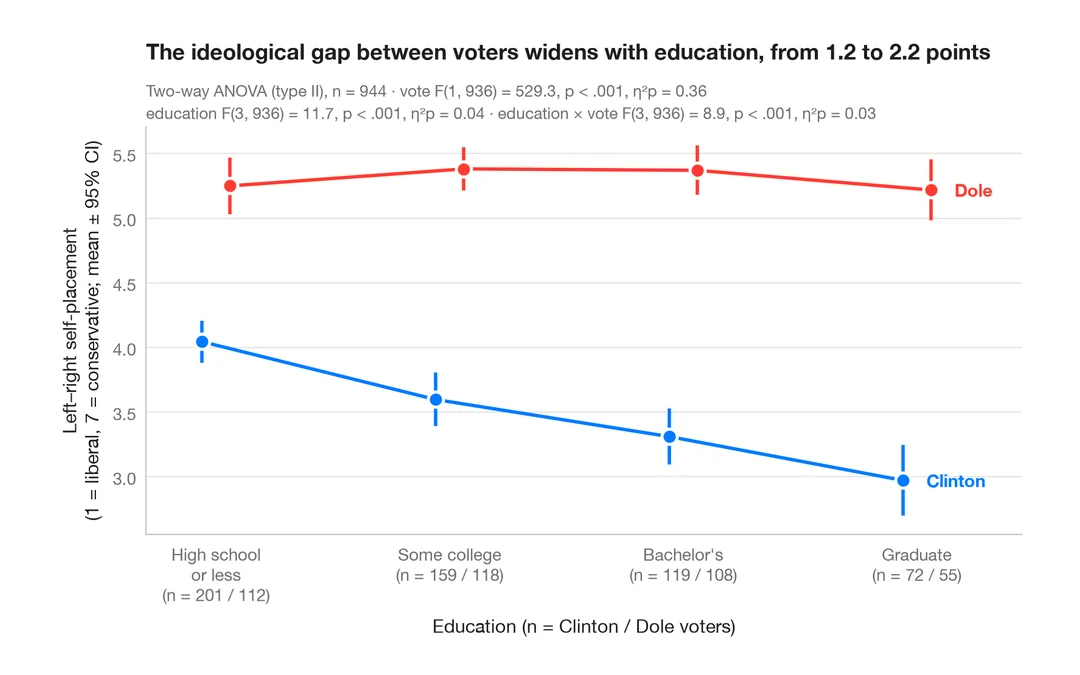
Interaction plot
Group means with 95% confidence intervals for two factors, with a two-way ANOVA.
ggpubr::ggline(add = "mean_ci") / ggstats