被试内比较
重复测量数据,每名被试一条线,附均值、重复测量方差分析和配对检验。
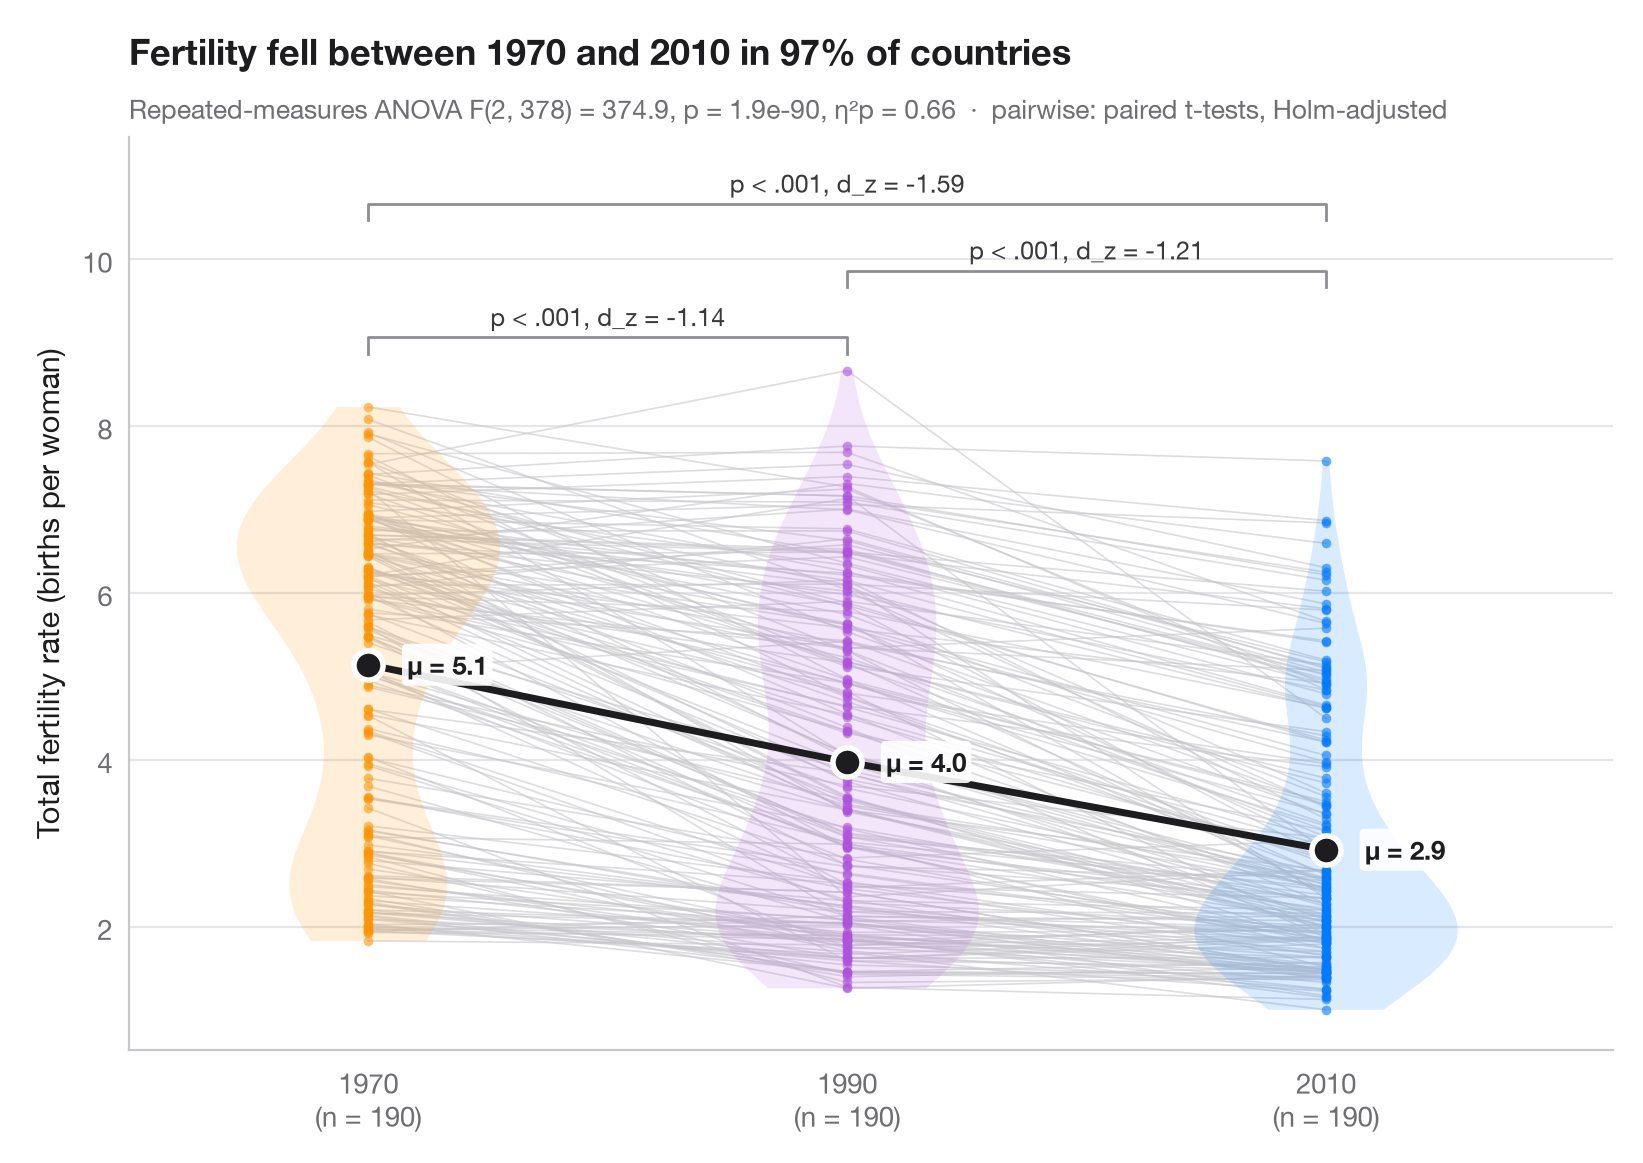
当同一批单位在每种条件下都接受测量时,值得关注的是每个单位内部的变化。细灰线连接每个国家的各次测量,便于看出是否几乎所有国家都朝同一方向变化;小提琴图展示各年份的分布,大圆点(以深色线相连)为各年份的均值。
数据为 statsmodels 附带的世界银行总和生育率(每名妇女生育的子女数,sm.datasets.fertility):在 1970、1990 和 2010 年均有数值的 190 个国家(已剔除区域汇总值),因此每个国家被测量了三次。副标题报告单因素重复测量方差分析(statsmodels.stats.anova.AnovaRM)及偏 η²,括号标注经 Holm 校正的配对 t 检验(scipy.stats.ttest_rel)及 Cohen's d_z(负值表示生育率下降)。
代码及图中文字均为英文。
from itertools import combinations

import matplotlib.pyplot as plt
import numpy as np
import pandas as pd
import statsmodels.api as sm
from scipy import stats
from statsmodels.stats.anova import AnovaRM
from statsmodels.stats.multitest import multipletests

# Data: fertility of the same countries in 1970, 1990 and 2010 (births per woman)
wb = sm.datasets.fertility.load_pandas().data
wb = wb[~wb["Country Name"].str.contains("classification|income levels|members|small states")]  # 5 aggregates
conditions = ["1970", "1990", "2010"]
wide = wb[conditions].dropna().reset_index(drop=True)
n = len(wide)
long = wide.rename_axis("id").reset_index().melt("id", var_name="condition", value_name="tfr")

# Repeated-measures ANOVA + partial eta squared
aov = AnovaRM(long, "tfr", "id", within=["condition"]).fit().anova_table.iloc[0]
eta_p = aov["F Value"] * aov["Num DF"] / (aov["F Value"] * aov["Num DF"] + aov["Den DF"])

# Pairwise paired t-tests (Holm) with Cohen's d_z
pairs = list(combinations(range(3), 2))
tests = [stats.ttest_rel(wide.iloc[:, j], wide.iloc[:, i]) for i, j in pairs]
adj_p = multipletests([t.pvalue for t in tests], method="holm")[1]
dz = [(wide.iloc[:, j] - wide.iloc[:, i]).mean() / (wide.iloc[:, j] - wide.iloc[:, i]).std()
      for i, j in pairs]

fig, ax = plt.subplots(figsize=(8, 5.6))
palette = ["#FF9500", "#AF52DE", "#007AFF"]
x = np.arange(3)
for _, row in wide.iterrows():                      # one line per subject
    ax.plot(x, row.values, color="#C7C7CC", lw=0.6, alpha=0.6, zorder=1)
for i, c in enumerate(palette):
    v = ax.violinplot(wide.iloc[:, i], positions=[i], widths=0.55, showextrema=False)
    v["bodies"][0].set(facecolor=c, alpha=0.15, edgecolor="none")
    ax.scatter(np.full(n, i), wide.iloc[:, i], s=12, color=c, alpha=0.6, lw=0, zorder=2)
means = wide.mean()
ax.plot(x, means, color="#1D1D1F", lw=2.5, zorder=3)
ax.scatter(x, means, s=110, color="#1D1D1F", edgecolor="white", lw=2, zorder=4)
for i, m in enumerate(means):
    ax.annotate(f"μ = {m:.1f}", (i, m), xytext=(14, 0), textcoords="offset points", va="center",
                fontsize=9.5, fontweight="semibold", color="#1D1D1F",
                bbox=dict(boxstyle="round,pad=0.2", fc="white", ec="none", alpha=0.9), zorder=5)

# Significance brackets
top, step = wide.values.max() + 0.4, 0.8
for h, ((i, j), p, d) in enumerate(sorted(zip(pairs, adj_p, dz), key=lambda t: t[0][1] - t[0][0])):
    y = top + h * step
    ax.plot([i, i, j, j], [y - 0.2, y, y, y - 0.2], color="#8E8E93", lw=1)
    label = "p < .001" if p < 0.001 else f"p = {p:.3f}"
    ax.text((i + j) / 2, y + 0.07, f"{label}, d_z = {d:.2f}", ha="center", va="bottom",
            fontsize=9, color="#3A3A3C")

ax.set_xticks(x, [f"{c}\n(n = {n})" for c in conditions])
ax.set_xlim(-0.5, 2.6)
ax.set_ylim(top=top + 3 * step)
ax.set_ylabel("Total fertility rate (births per woman)")
fell = (wide["2010"] < wide["1970"]).mean()
ax.set_title(f"Fertility fell between 1970 and 2010 in {fell:.0%} of countries", pad=26)
ax.text(0, 1.02, f"Repeated-measures ANOVA F({aov['Num DF']:.0f}, {aov['Den DF']:.0f}) = "
        f"{aov['F Value']:.1f}, p = {aov['Pr > F']:.1e}, η²p = {eta_p:.2f}  ·  "
        "pairwise: paired t-tests, Holm-adjusted", transform=ax.transAxes,
        fontsize=9.5, color="#6E6E73")
plt.show()
图表使用了可选的 PyStatlas 样式:添加 plt.style.use("pystatlas.mplstyle") 即可完全还原其外观。
数据来源
- World Bank fertility rates by country, 1960–2013. World Bank. Fertility rate, total (births per woman), indicator SP.DYN.TFRT.IN. World Development Indicators. https://data.worldbank.org/indicator/SP.DYN.TFRT.IN
Primary sources: UN Population Division, UN Statistical Division, national statistical offices, Eurostat and others. Distributed with statsmodels (sm.datasets.fertility) under the World Bank terms of use.
这些示例用于说明统计方法。图表标题描述的是该图在这些特定数据中呈现的内容——这些数据往往样本较小、年代较早或并不完整——而不是作者对实质问题的立场。关于解释、背景和数据质量,请以此处引用的原始来源为准。
如何引用
PyStatlas 由 Thierry Warin 创建并维护。如果它对你的工作有所帮助,敬请引用。
Warin, T. (2026). Within-subjects comparison. In PyStatlas: A Python Gallery of Statistical Graphics for the Social Sciences. https://warint.github.io/pystatlas/group-comparisons/within-subjects/
@misc{warin2026statlas,
  author       = {Warin, Thierry},
  title        = {PyStatlas: A Python Gallery of Statistical Graphics for the Social Sciences},
  year         = {2026},
  howpublished = {\url{https://warint.github.io/pystatlas/}},
  note         = {Source code: https://github.com/warint/pystatlas}
}