季节子序列图
各日历月份的工业营业额在历年中的变化,以月均值作为参照。
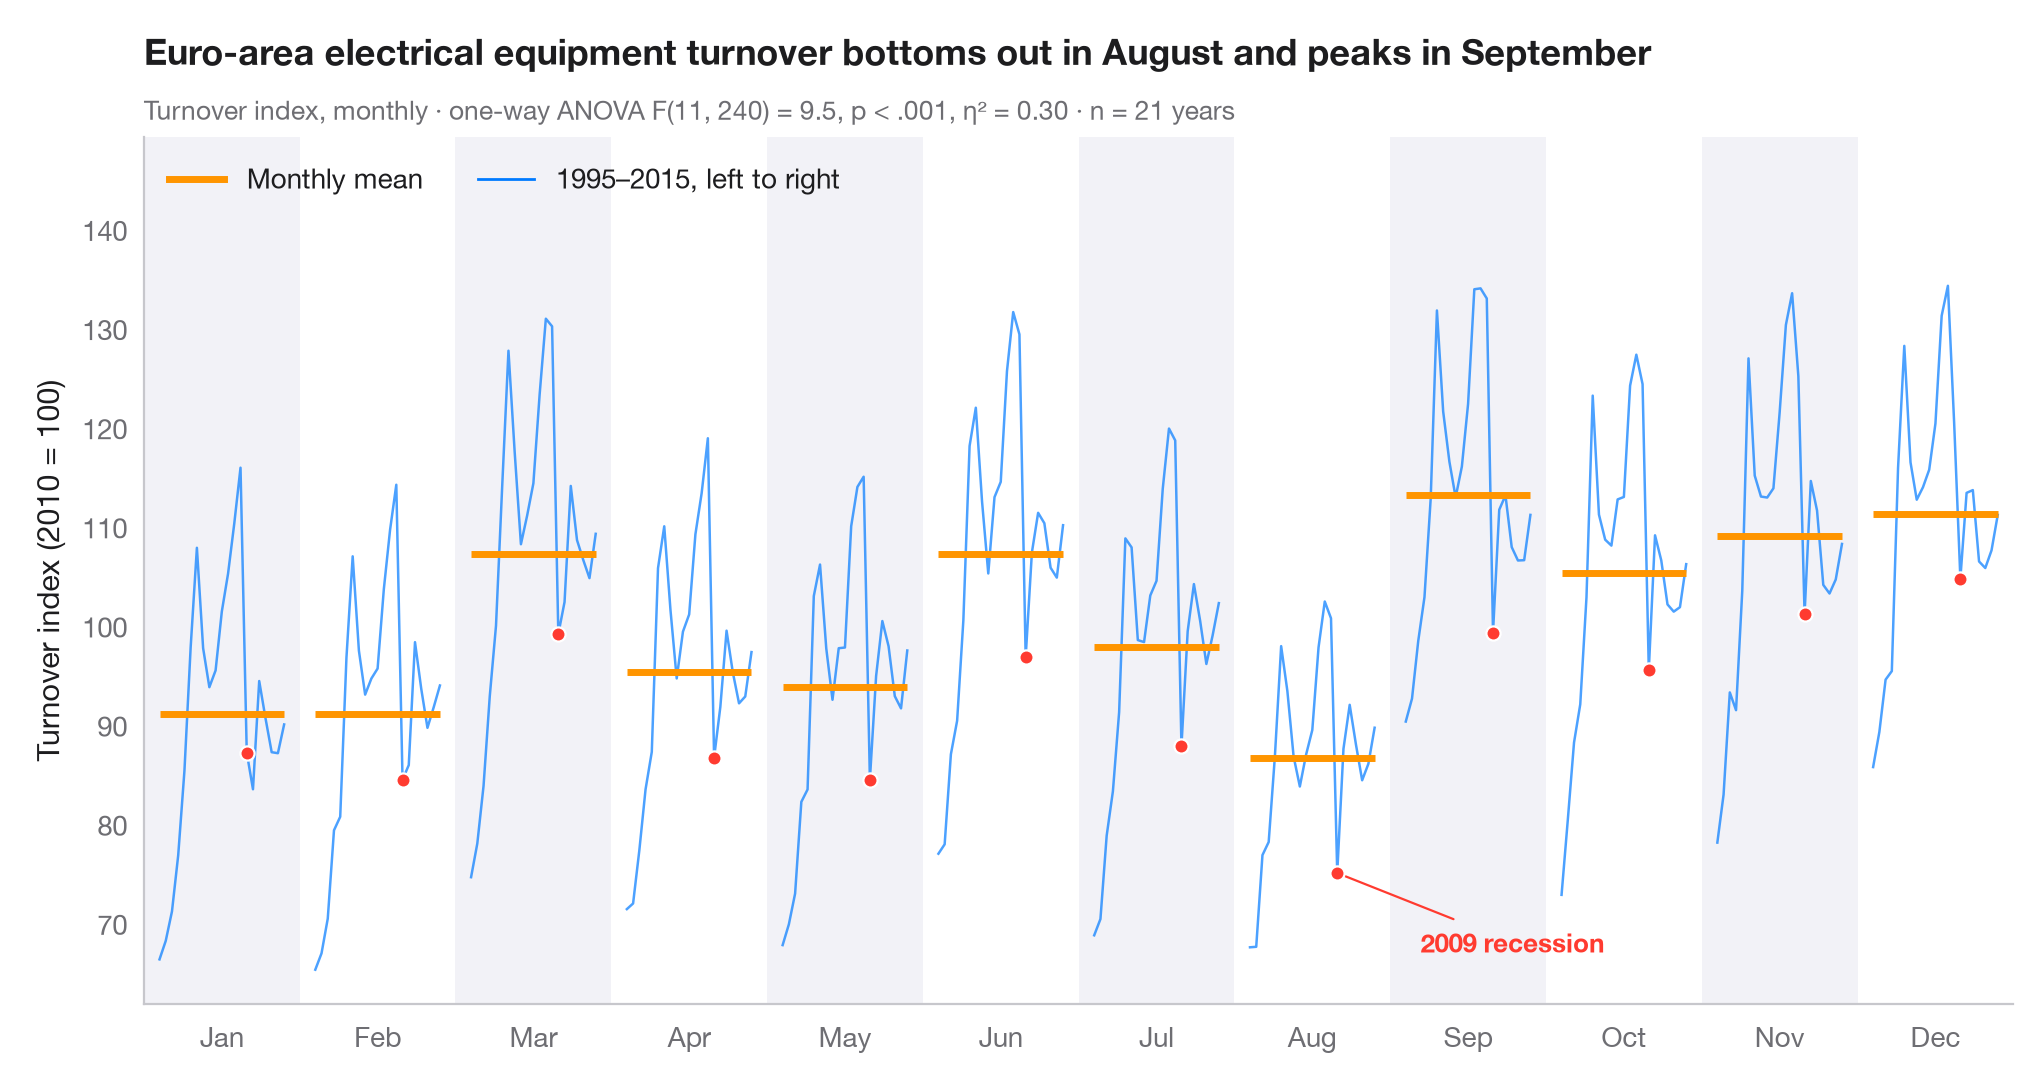
季节子序列图(又称月份图)将月度序列切分为十二条迷你时间序列,每个日历月份一条,各自贯穿所有年份。水平横条为该月的均值,因此从一根横条到下一根横条即可读出季节形态,而每个面板内的折线则显示该月份在不同年份间是在漂移还是在波动。
数据为 Eurostat 发布的欧元区电气设备制造业月度营业额指数(2010 = 100),未经季节调整,涵盖 1995–2015 年共 21 个完整年份(statsmodels.datasets.elec_equip,随 statsmodels 提供)。每年 8 月工厂夏季停工时营业额下降,并在每个季度末回升。副标题报告以月份为因素的营业额单因素方差分析(scipy.stats.f_oneway)以及 η²,即总变异中由季节解释的比例——这里比例不高,因为各面板内的长期趋势解释了其余变异的大部分。2009 年经济衰退被突出显示。
代码及图中文字均为英文。
import matplotlib.pyplot as plt
import numpy as np
from scipy import stats
from statsmodels.datasets import elec_equip

# Data: monthly turnover index 1995–2015, reshaped to one row per year, one column per month
turnover = elec_equip.load().data.iloc[:, 0][:"2015"]
years = turnover.index.year.unique().to_numpy()
months = turnover.index[:12].strftime("%b")
values = turnover.to_numpy().reshape(len(years), 12)

# Seasonal effect: one-way ANOVA of turnover on month, with eta squared
F, p = stats.f_oneway(*values.T)
eta2 = ((values.mean(0) - values.mean()) ** 2).sum() * len(years) / ((values - values.mean()) ** 2).sum()

fig, ax = plt.subplots(figsize=(10, 5.2))
width = 0.8
x_in = (years - years.min()) / (years.max() - years.min()) * width - width / 2
highlight = {2009: list(months)}

# One mini series per month, plus its mean
for i, m in enumerate(months):
    v = values[:, i]
    if i % 2 == 0:
        ax.axvspan(i - 0.5, i + 0.5, color="#F2F2F7", lw=0, zorder=0)
    ax.plot(i + x_in, v, color="#007AFF", lw=0.9, alpha=0.7)
    ax.hlines(v.mean(), i - width / 2, i + width / 2, color="#FF9500", lw=2.5, zorder=3)
    for yr, ms in highlight.items():
        if m in ms:
            j = np.where(years == yr)[0][0]
            ax.scatter(i + x_in[j], v[j], s=26, color="#FF3B30", edgecolor="white", lw=0.8, zorder=4)

aug09 = (7 + x_in[years == 2009][0], values[years == 2009, 7][0])
ax.annotate("2009 recession", aug09, xytext=(30, -25), textcoords="offset points",
            ha="left", va="center", fontsize=9.5,
            color="#FF3B30", fontweight="semibold",
            arrowprops=dict(arrowstyle="-", color="#FF3B30", lw=0.8))
ax.set_xticks(range(12), months)
ax.set_xlim(-0.5, 11.5)
ax.grid(axis="y")
ax.set_ylabel("Turnover index (2010 = 100)")
ax.plot([], [], color="#FF9500", lw=2.5, label="Monthly mean")
ax.plot([], [], color="#007AFF", lw=1, label=f"{years.min()}–{years.max()}, left to right")
ax.legend(loc="upper left", ncols=2)
ax.set_ylim(top=values.max() + 15)
lo_m = turnover.index[values.mean(0).argmin()].strftime("%B")   # first year runs Jan–Dec
hi_m = turnover.index[values.mean(0).argmax()].strftime("%B")
p_txt = "p < .001" if p < 0.001 else f"p = {p:.3f}"
ax.set_title(f"Euro-area electrical equipment turnover bottoms out in {lo_m} and peaks in {hi_m}", pad=26)
ax.text(0, 1.02, f"Turnover index, monthly · one-way ANOVA F(11, {values.size - 12}) = {F:.1f}, "
        f"{p_txt}, η² = {eta2:.2f} · n = {len(years)} years",
        transform=ax.transAxes, fontsize=9.5, color="#6E6E73")
plt.show()
图表使用了可选的 PyStatlas 样式:添加 plt.style.use("pystatlas.mplstyle") 即可完全还原其外观。
数据来源
- Euro-area electrical-equipment turnover, monthly, 1995–2016. Eurostat. Euro area (18, fixed composition) total turnover index, manufacture of electrical equipment (NACE Rev. 2), working-day adjusted, not seasonally adjusted. https://ec.europa.eu/eurostat
Distributed with statsmodels (statsmodels.datasets.elec_equip); public domain.
这些示例用于说明统计方法。图表标题描述的是该图在这些特定数据中呈现的内容——这些数据往往样本较小、年代较早或并不完整——而不是作者对实质问题的立场。关于解释、背景和数据质量,请以此处引用的原始来源为准。
如何引用
PyStatlas 由 Thierry Warin 创建并维护。如果它对你的工作有所帮助,敬请引用。
Warin, T. (2026). Seasonal subseries plot. In PyStatlas: A Python Gallery of Statistical Graphics for the Social Sciences. https://warint.github.io/pystatlas/time-series/seasonal-subseries/
@misc{warin2026statlas,
  author       = {Warin, Thierry},
  title        = {PyStatlas: A Python Gallery of Statistical Graphics for the Social Sciences},
  year         = {2026},
  howpublished = {\url{https://warint.github.io/pystatlas/}},
  note         = {Source code: https://github.com/warint/pystatlas}
}