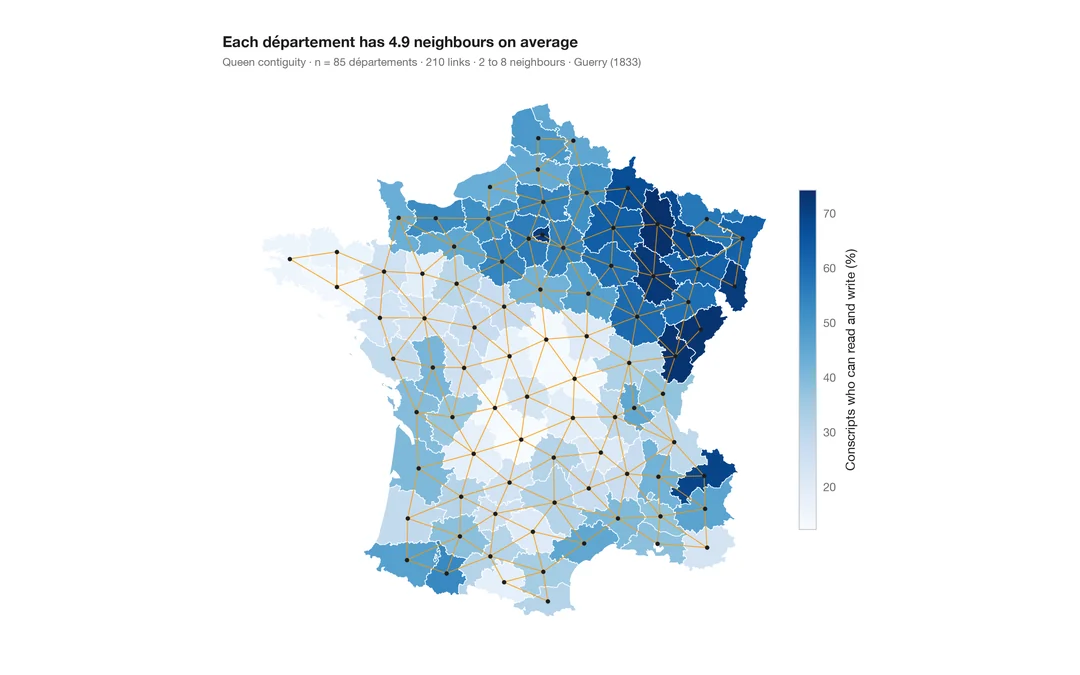
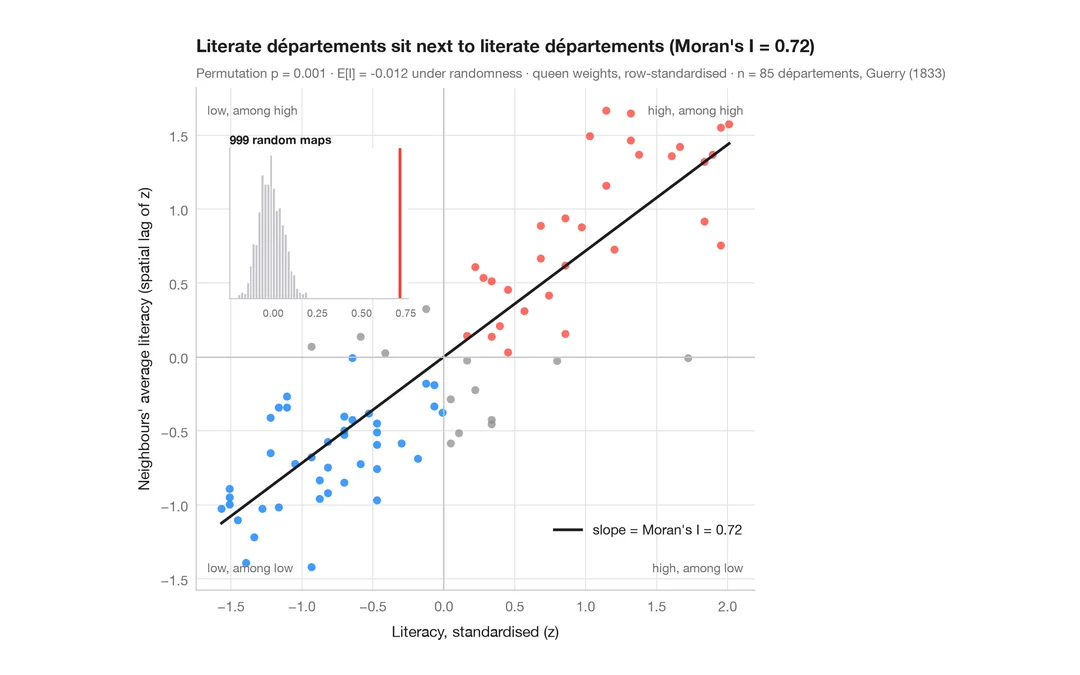
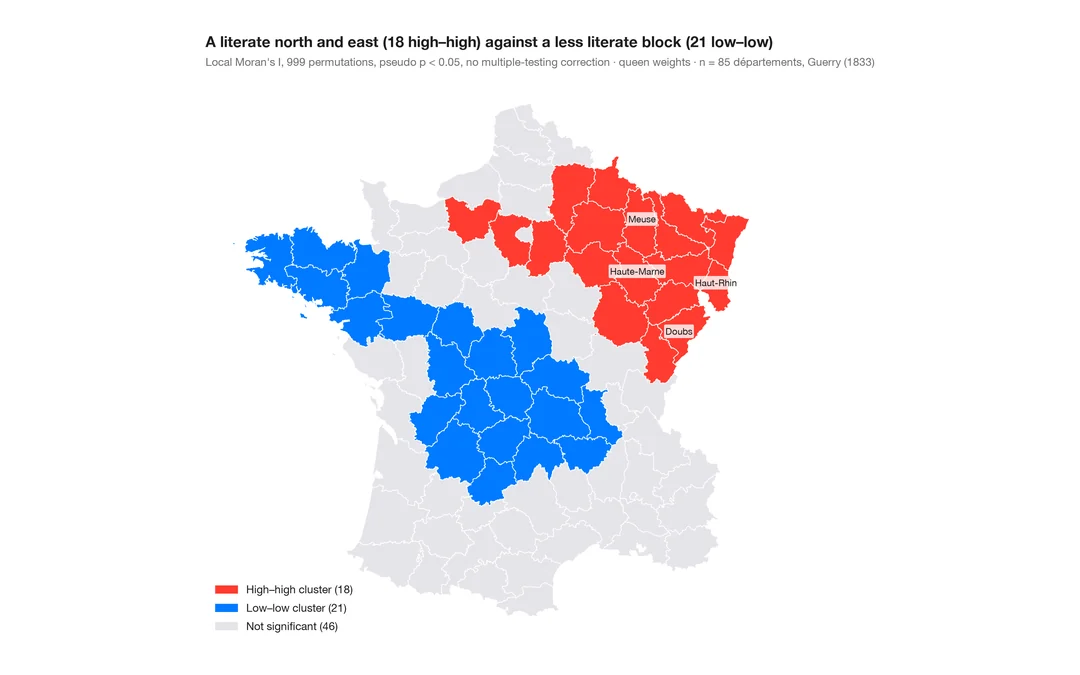
空间相关图
随邻接阶数增加的莫兰 I,附置换包络——空间聚集能延伸多远。
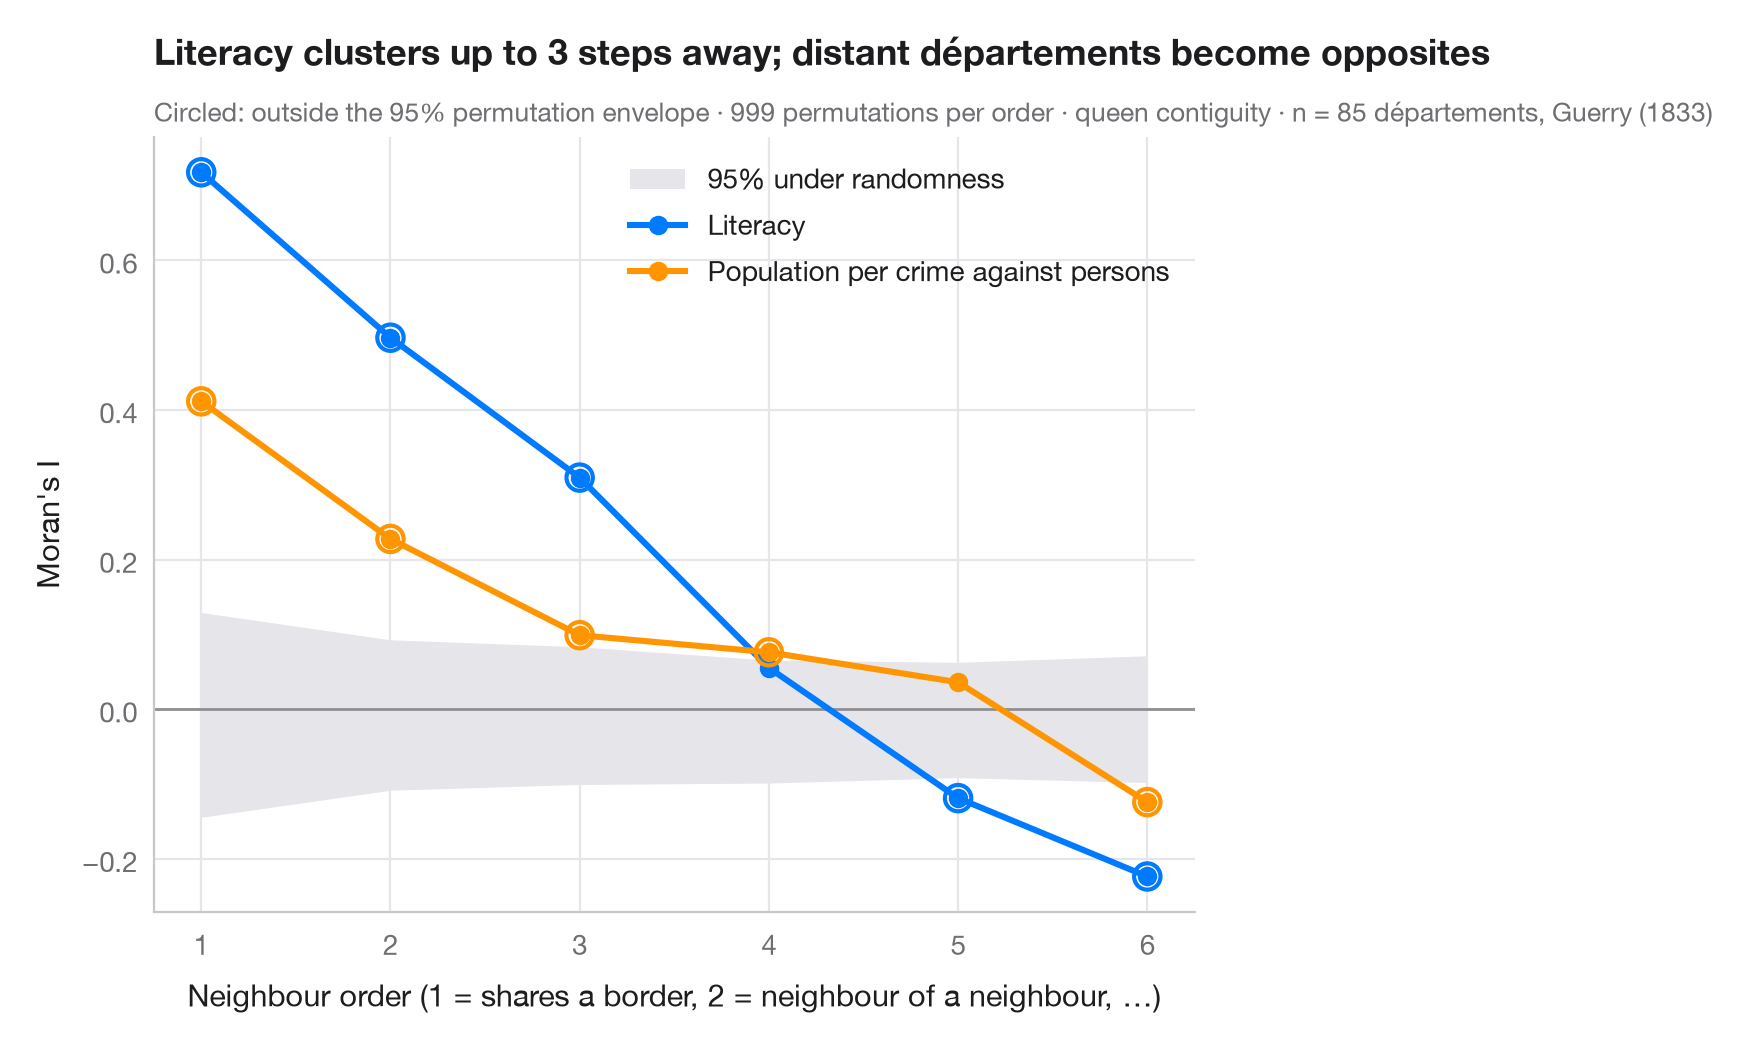
用一阶邻居计算的莫兰 I 衡量最短距离上的聚集。空间相关图对二阶邻居(邻居的邻居,不含更近者)、三阶邻居等重复同样的计算。曲线显示现象的空间尺度:两个地区相隔多少步仍然相似,以及相距较远的地区是否变得相反——即 I 为负——当一个国家分成两大区域时就会如此。它是时间序列自相关函数在空间上的对应物。
灰色带是空间随机性下 I 的 95% 范围,由每一阶的 999 次置换得到;带外的点在不存在空间结构时不太可能出现。比较的是盖里(1833 年)道德统计中 85 个省的两个变量:识字率,以及每起针对人身犯罪所对应的人口(数值越高,犯罪越少)。权重为 libpysal.weights.higher_order 给出的高阶后式邻接并经行标准化;I 来自 esda.Moran。
代码及图中文字均为英文。
import geopandas as gpd
import matplotlib.pyplot as plt
import numpy as np
from esda.moran import Moran
from libpysal import examples, weights

# Data: 85 French départements, c. 1830 (Guerry, 1833)
g = gpd.read_file(examples.load_example("Guerry").get_path("guerry.shp"))
variables = {"Litercy": ("Literacy", "#007AFF"),
             "Crm_prs": ("Population per crime against persons", "#FF9500")}

w1 = weights.Queen.from_dataframe(g, use_index=False)
orders = range(1, 7)
res = {v: [] for v in variables}
for k in orders:
    wk = weights.higher_order(w1, k, silence_warnings=True)    # exactly k steps away
    wk.transform = "r"
    for v in variables:
        m = Moran(g[v].to_numpy(dtype=float), wk, permutations=999)
        res[v].append((m.I, *np.percentile(m.sim, [2.5, 97.5]), m.p_sim))

fig, ax = plt.subplots(figsize=(8, 5))
env = np.array(res["Litercy"])[:, 1:3]                   # envelope (similar for both variables)
ax.fill_between(orders, env[:, 0], env[:, 1], color="#E5E5EA", lw=0, label="95% under randomness")
ax.axhline(0, color="#8E8E93", lw=1)
for v, (name, c) in variables.items():
    a = np.array(res[v])
    ax.plot(orders, a[:, 0], color=c, lw=2.2, marker="o", label=name)
    out = (a[:, 0] < a[:, 1]) | (a[:, 0] > a[:, 2])
    ax.scatter(np.array(orders)[out], a[out, 0], s=90, facecolor="none", edgecolor=c, lw=1.5, zorder=4)
ax.set_xticks(list(orders))
ax.set_xlabel("Neighbour order (1 = shares a border, 2 = neighbour of a neighbour, …)")
ax.set_ylabel("Moran's I")
ax.grid(axis="x")
ax.legend(loc="upper right")

lit = np.array(res["Litercy"])
reach = max(k for k, (I, lo, hi, p) in zip(orders, lit) if I > hi)
ax.set_title(f"Literacy clusters up to {reach} steps away; distant départements become opposites", pad=26)
ax.text(0, 1.02, "Circled: outside the 95% permutation envelope · 999 permutations per order · "
        f"queen contiguity · n = {w1.n} départements, Guerry (1833)",
        transform=ax.transAxes, fontsize=9.5, color="#6E6E73")
plt.show()
图表使用了可选的 PyStatlas 样式:添加 plt.style.use("pystatlas.mplstyle") 即可完全还原其外观。
数据来源
- Guerry's moral statistics of France, c. 1830 (85 départements). Guerry, A.-M. (1833). Essai sur la statistique morale de la France. Crochard. Data as compiled in Friendly, M. (2007). A.-M. Guerry's moral statistics of France: Challenges for multivariable spatial analysis. Statistical Science, 22(3), 368–399. https://doi.org/10.1214/07-STS241
Prepared by the Center for Spatial Data Science (University of Chicago) from the R package Guerry (Friendly and Dray), provided “as is”. Fetched once and cached by libpysal (examples.load_example("Guerry")). Variables come from Guerry's tables as translated by Whitt and Reinking (2002).
这些示例用于说明统计方法。图表标题描述的是该图在这些特定数据中呈现的内容——这些数据往往样本较小、年代较早或并不完整——而不是作者对实质问题的立场。关于解释、背景和数据质量,请以此处引用的原始来源为准。
如何引用
PyStatlas 由 Thierry Warin 创建并维护。如果它对你的工作有所帮助,敬请引用。
Warin, T. (2026). Spatial correlogram. In PyStatlas: A Python Gallery of Statistical Graphics for the Social Sciences. https://warint.github.io/pystatlas/spatial-data/spatial-correlogram/
@misc{warin2026statlas,
  author       = {Warin, Thierry},
  title        = {PyStatlas: A Python Gallery of Statistical Graphics for the Social Sciences},
  year         = {2026},
  howpublished = {\url{https://warint.github.io/pystatlas/}},
  note         = {Source code: https://github.com/warint/pystatlas}
}