Spatial correlogram
Moran's I at increasing neighbour orders, with a permutation envelope — how far spatial clustering reaches.
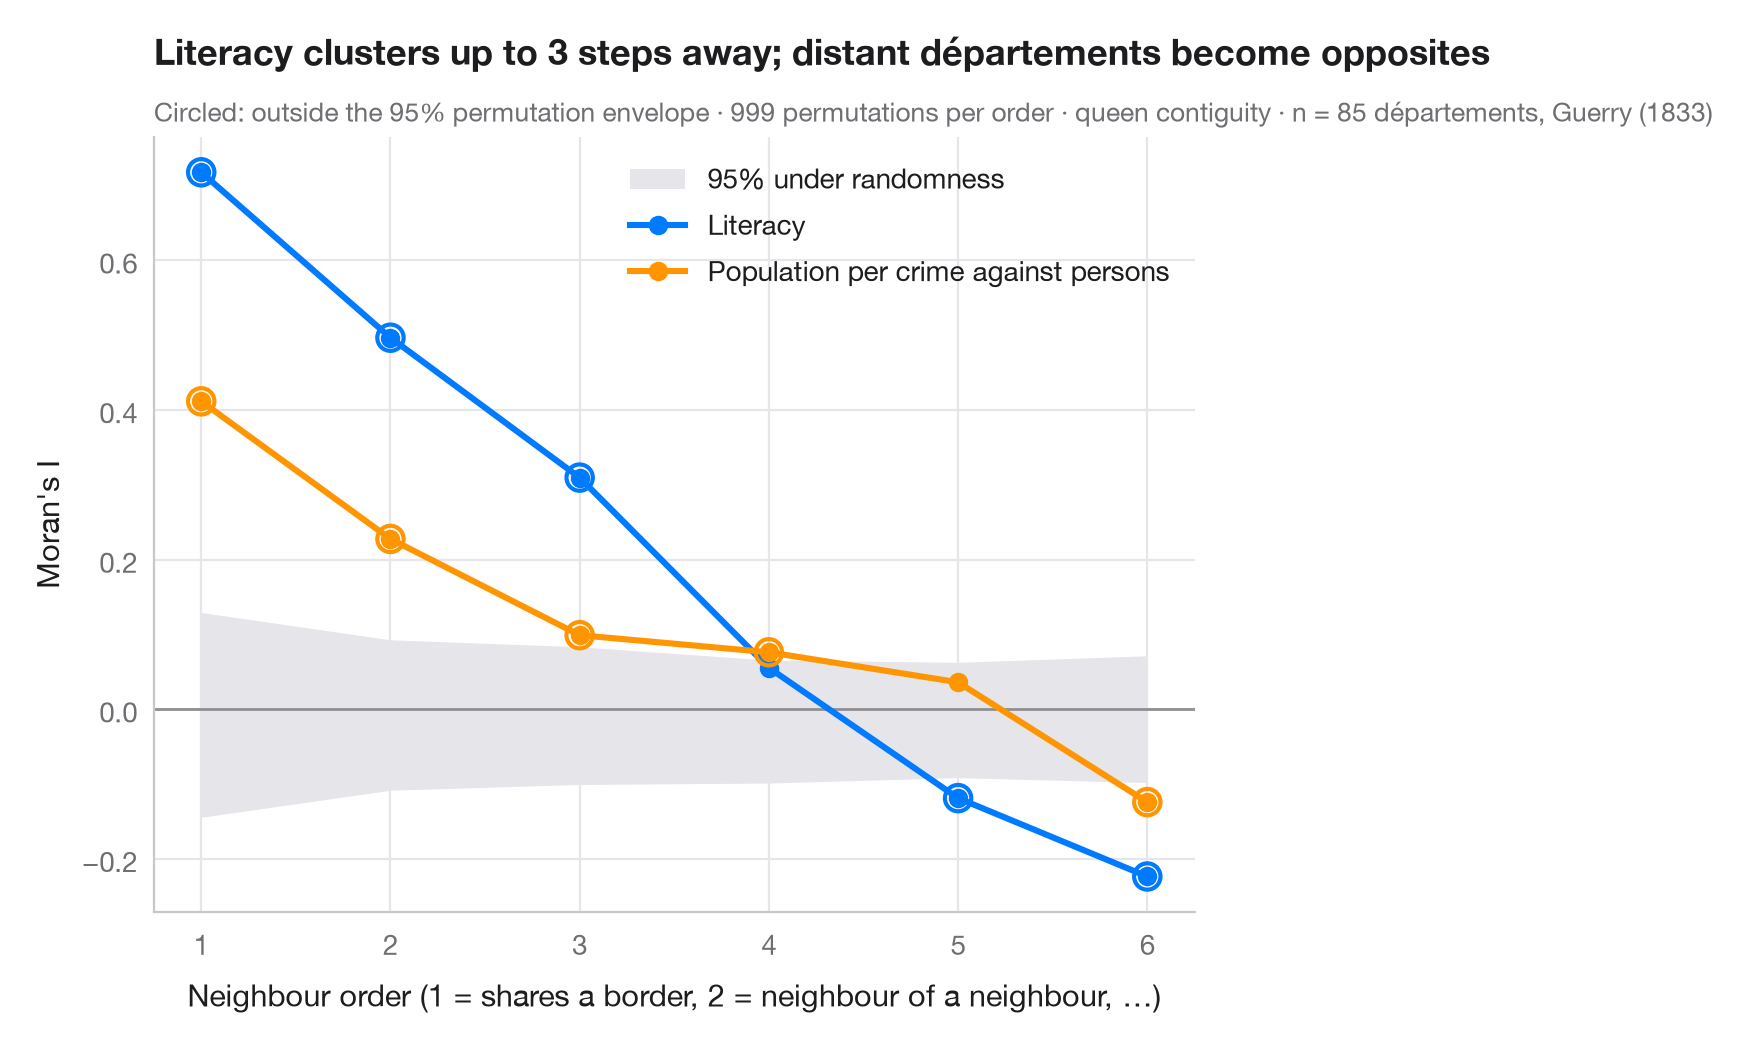
Moran's I with first-order neighbours measures clustering at the shortest range. A spatial correlogram repeats the computation for neighbours of order 2 (neighbours of neighbours, excluding closer ones), 3, and so on. The curve shows the spatial scale of a pattern: how many steps away two areas can be and still resemble each other, and whether distant areas become opposites — negative I — as they do when a country is split into two large regions. It is the spatial counterpart of the autocorrelation function of a time series.
The grey band is the 95% range of I under spatial randomness, from 999
permutations at each order; points outside it are unlikely under no spatial
structure. Two variables from Guerry's (1833) moral statistics of 85
départements are compared: literacy, and population per crime against
persons (higher means fewer crimes). Weights are higher-order queen
contiguity from libpysal.weights.higher_order, row-standardised; I comes
from esda.Moran.
import geopandas as gpd
import matplotlib.pyplot as plt
import numpy as np
from esda.moran import Moran
from libpysal import examples, weights

# Data: 85 French départements, c. 1830 (Guerry, 1833)
g = gpd.read_file(examples.load_example("Guerry").get_path("guerry.shp"))
variables = {"Litercy": ("Literacy", "#007AFF"),
             "Crm_prs": ("Population per crime against persons", "#FF9500")}

w1 = weights.Queen.from_dataframe(g, use_index=False)
orders = range(1, 7)
res = {v: [] for v in variables}
for k in orders:
    wk = weights.higher_order(w1, k, silence_warnings=True)    # exactly k steps away
    wk.transform = "r"
    for v in variables:
        m = Moran(g[v].to_numpy(dtype=float), wk, permutations=999)
        res[v].append((m.I, *np.percentile(m.sim, [2.5, 97.5]), m.p_sim))

fig, ax = plt.subplots(figsize=(8, 5))
env = np.array(res["Litercy"])[:, 1:3]                   # envelope (similar for both variables)
ax.fill_between(orders, env[:, 0], env[:, 1], color="#E5E5EA", lw=0, label="95% under randomness")
ax.axhline(0, color="#8E8E93", lw=1)
for v, (name, c) in variables.items():
    a = np.array(res[v])
    ax.plot(orders, a[:, 0], color=c, lw=2.2, marker="o", label=name)
    out = (a[:, 0] < a[:, 1]) | (a[:, 0] > a[:, 2])
    ax.scatter(np.array(orders)[out], a[out, 0], s=90, facecolor="none", edgecolor=c, lw=1.5, zorder=4)
ax.set_xticks(list(orders))
ax.set_xlabel("Neighbour order (1 = shares a border, 2 = neighbour of a neighbour, …)")
ax.set_ylabel("Moran's I")
ax.grid(axis="x")
ax.legend(loc="upper right")

lit = np.array(res["Litercy"])
reach = max(k for k, (I, lo, hi, p) in zip(orders, lit) if I > hi)
ax.set_title(f"Literacy clusters up to {reach} steps away; distant départements become opposites", pad=26)
ax.text(0, 1.02, "Circled: outside the 95% permutation envelope · 999 permutations per order · "
        f"queen contiguity · n = {w1.n} départements, Guerry (1833)",
        transform=ax.transAxes, fontsize=9.5, color="#6E6E73")
plt.show()
Figures use the optional PyStatlas style: add plt.style.use("pystatlas.mplstyle") to match the look exactly.
Data source
- Guerry's moral statistics of France, c. 1830 (85 départements). Guerry, A.-M. (1833). Essai sur la statistique morale de la France. Crochard. Data as compiled in Friendly, M. (2007). A.-M. Guerry's moral statistics of France: Challenges for multivariable spatial analysis. Statistical Science, 22(3), 368–399. https://doi.org/10.1214/07-STS241
Prepared by the Center for Spatial Data Science (University of Chicago) from the R package Guerry (Friendly and Dray), provided “as is”. Fetched once and cached by libpysal (examples.load_example("Guerry")). Variables come from Guerry's tables as translated by Whitt and Reinking (2002).
The examples illustrate statistical methods. Their titles describe what each figure shows in these particular data — often a small, dated or partial sample — not the author's position on the substantive question. For interpretation, context and data quality, rely on the original sources cited here.
How to cite
PyStatlas is created and maintained by Thierry Warin. If it helped your work, please cite it.
Warin, T. (2026). Spatial correlogram. In PyStatlas: A Python Gallery of Statistical Graphics for the Social Sciences. https://warint.github.io/pystatlas/spatial-data/spatial-correlogram/
@misc{warin2026statlas,
  author       = {Warin, Thierry},
  title        = {PyStatlas: A Python Gallery of Statistical Graphics for the Social Sciences},
  year         = {2026},
  howpublished = {\url{https://warint.github.io/pystatlas/}},
  note         = {Source code: https://github.com/warint/pystatlas}
}More in Spatial data
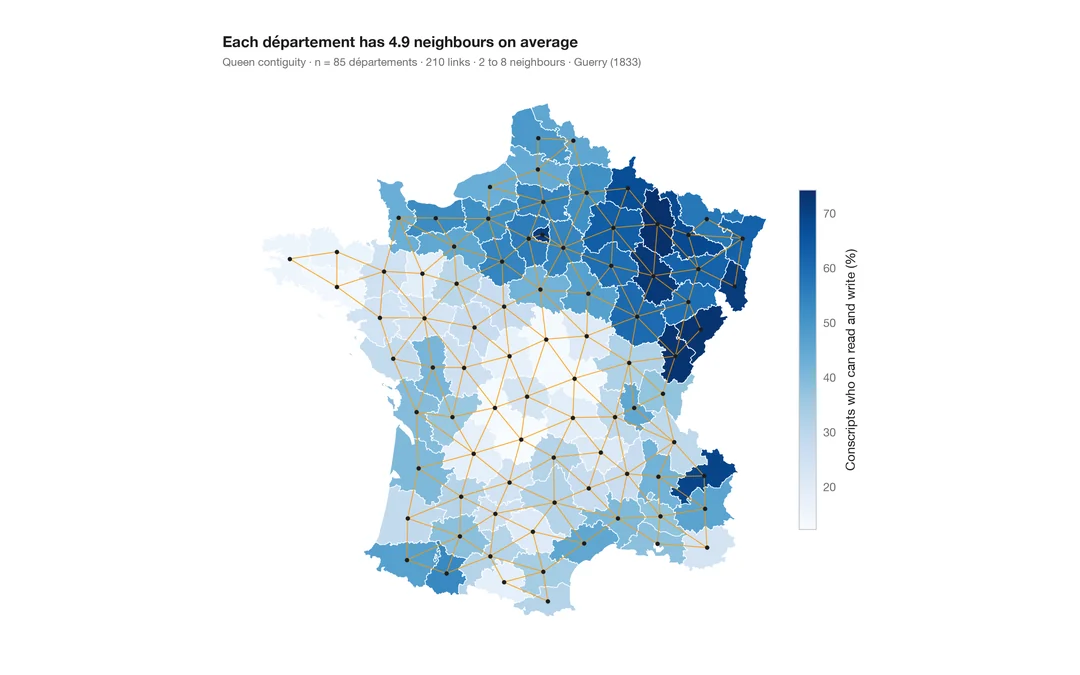
Choropleth with spatial weights
A map of one variable with the neighbour network drawn on top — the structure every spatial statistic relies on.
spdep::poly2nb() + plot(nb, coords)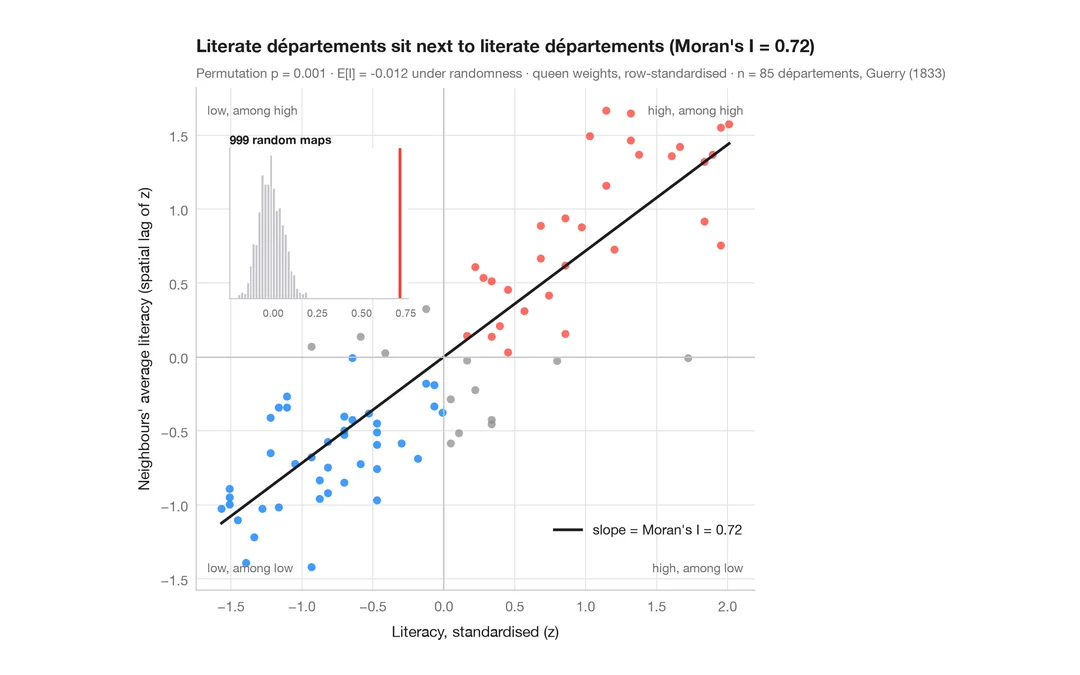
Moran scatterplot (global autocorrelation)
Each area against the average of its neighbours, with Moran's I, its permutation test and the reference distribution.
spdep::moran.plot() + spdep::moran.mc()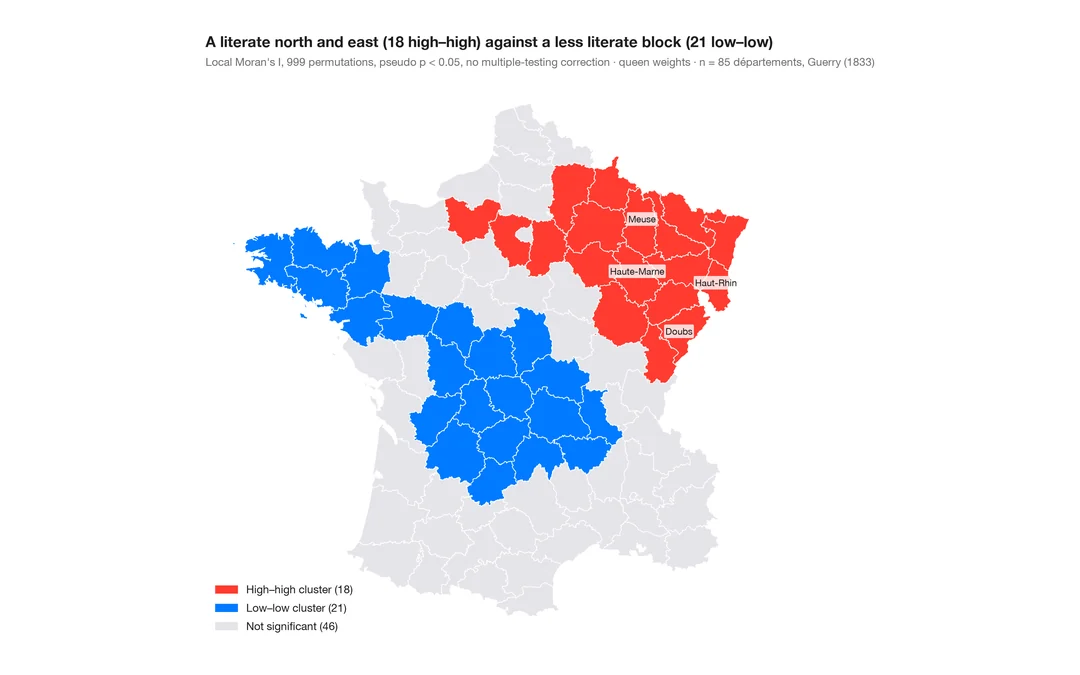
LISA cluster map (local autocorrelation)
Where the clusters and spatial outliers are — local Moran's I for each area, mapped with its permutation significance.
spdep::localmoran_perm() / rgeoda::local_moran()