交互效应
均值 ± 1 SD 处的简单斜率与 Johnson–Neyman 图:大学预备课程与数学成绩的关系,受学生贫困程度调节。
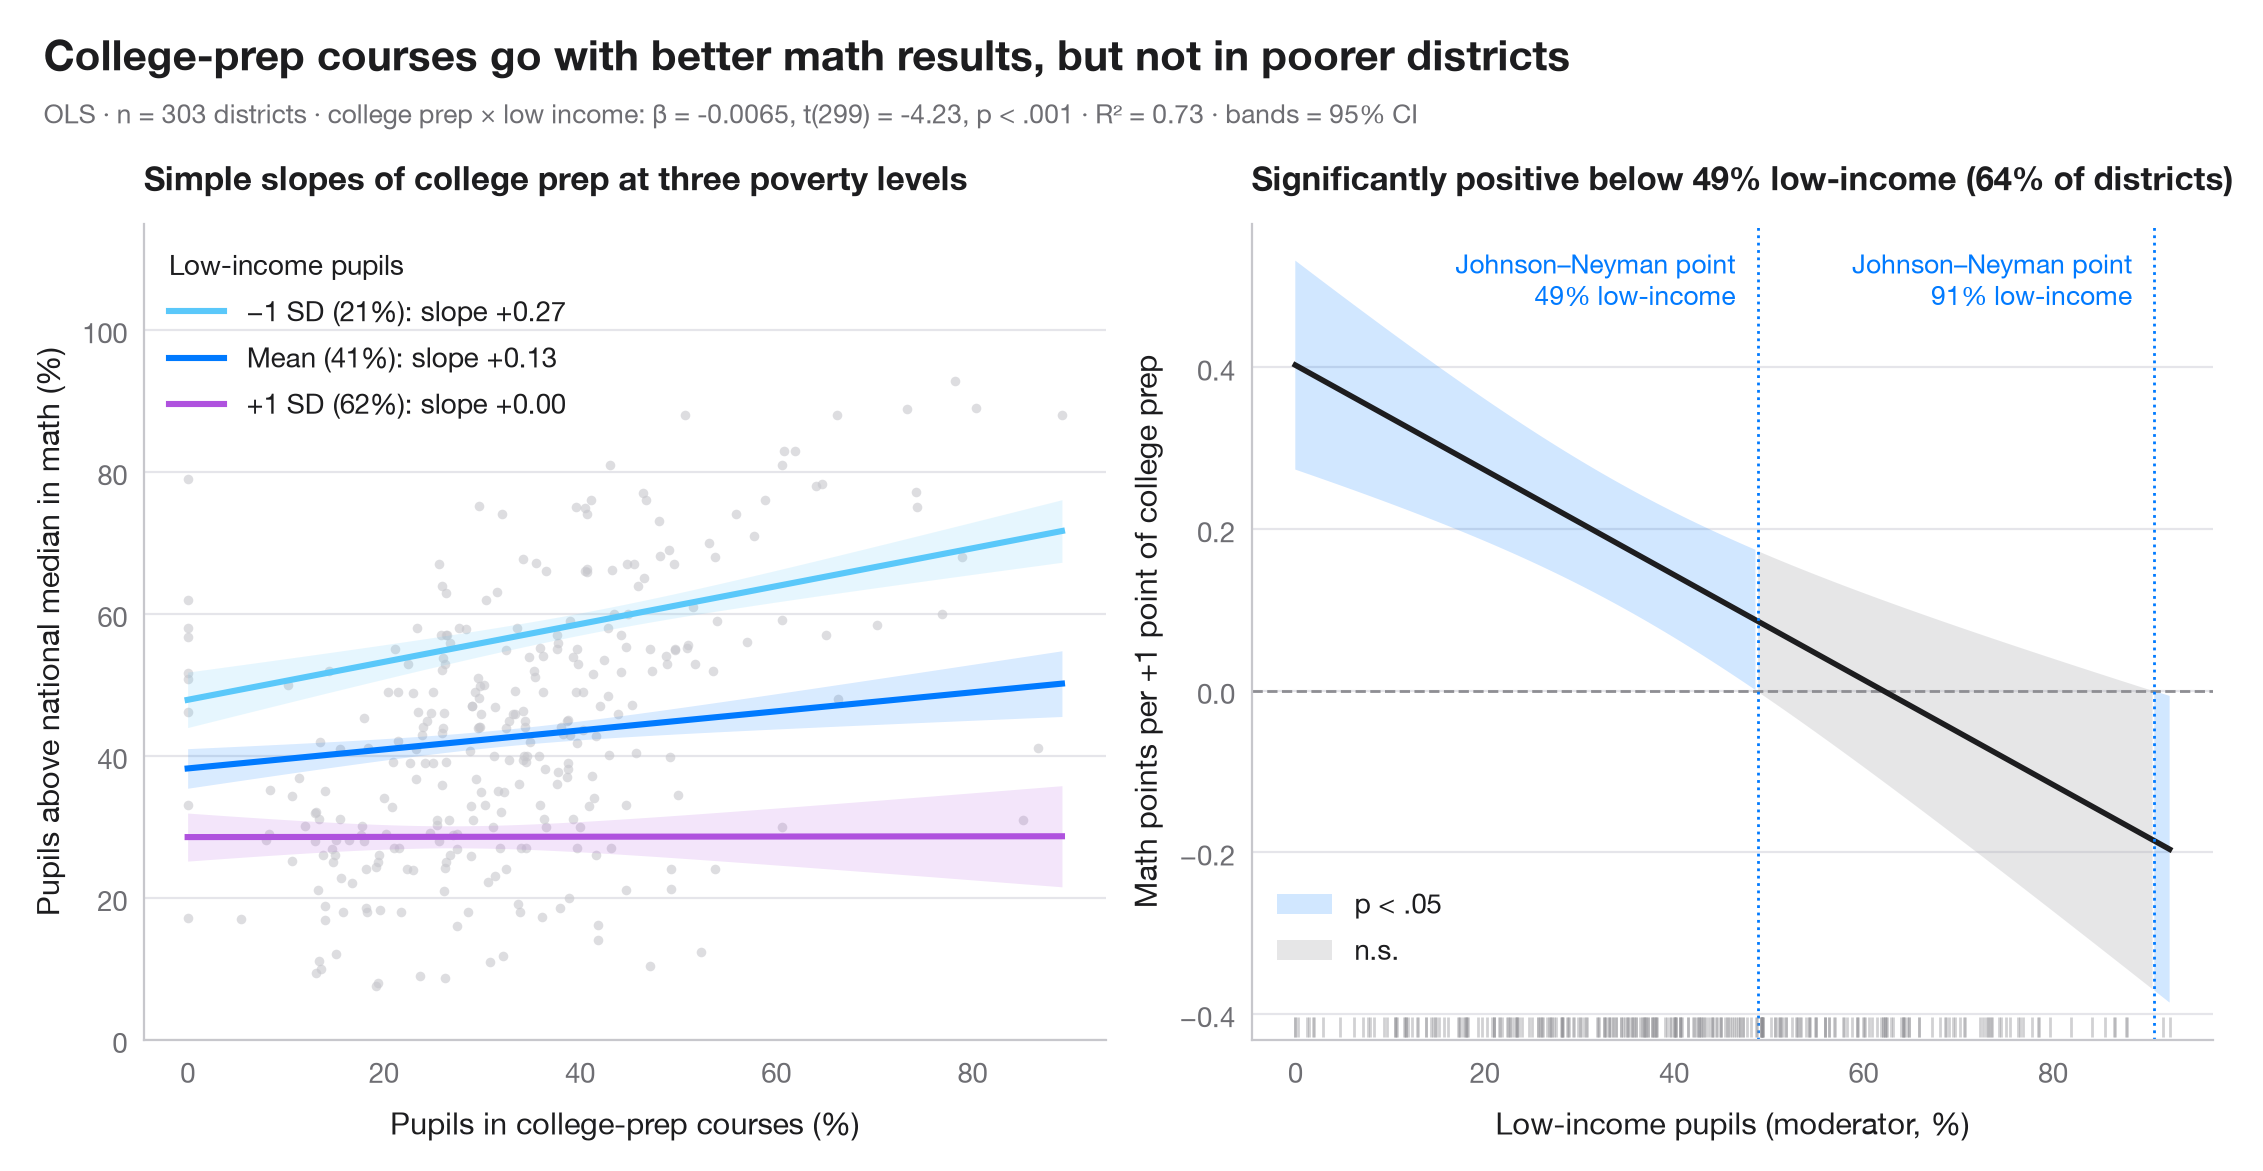
交互项意味着一个预测变量的斜率取决于另一个变量。左图在调节变量的三个取值——均值及 ±1 个标准差——处分别画出该斜率,各附 95% 置信带。右图是 Johnson–Neyman 视图:焦点预测变量的边际效应 β₁ + β₃·moderator 在调节变量整个取值范围内的变化,附 95% 置信区间。置信带不包含零的区域效应显著;转折点即 Johnson–Neyman 点。
数据为 statsmodels 自带的 STAR98 测试中加州 303 个学区(sm.datasets.star98)。因变量为数学成绩高于全国中位数的学生比例(%);焦点预测变量为修读大学预备(UC/CSU)课程的学生比例,调节变量为低收入学生比例,模型为 smf.ols("math ~ prep * lowinc")。在较富裕的学区,大学预备课程比例越高,数学成绩越好;但随着贫困程度上升,这一关联逐渐减弱——并且只在最贫困的两个学区变为显著为负,因此最右侧出现第二个 Johnson–Neyman 点。边际效应的方差由 cov_params() 手工计算:Var(β₁) + 2m·Cov(β₁, β₃) + m²·Var(β₃)。
代码及图中文字均为英文。
import matplotlib.pyplot as plt
import numpy as np
import pandas as pd
import statsmodels.api as sm
import statsmodels.formula.api as smf
from scipy import stats

# Data: math results, college-prep enrolment and low-income pupils in 303 California districts
raw = sm.datasets.star98.load_pandas().data
df = pd.DataFrame({"math": 100 * raw.NABOVE / (raw.NABOVE + raw.NBELOW),
                   "prep": raw.PCTAF, "lowinc": raw.LOWINC})
model = smf.ols("math ~ prep * lowinc", data=df).fit()
b, V = model.params, model.cov_params()
t_crit = stats.t.ppf(0.975, model.df_resid)

fig, (ax1, ax2) = plt.subplots(1, 2, figsize=(11, 5))

# Left: simple slopes of college prep at low income = mean − 1 SD, mean, mean + 1 SD
ax1.scatter(df.prep, df.math, s=12, color="#C7C7CC", alpha=0.6, lw=0)
prep = np.linspace(df.prep.min(), df.prep.max(), 100)
m, s = df.lowinc.mean(), df.lowinc.std()
for low, lab, c in [(m - s, "−1 SD", "#5AC8FA"), (m, "Mean", "#007AFF"), (m + s, "+1 SD", "#AF52DE")]:
    pred = model.get_prediction(pd.DataFrame({"prep": prep, "lowinc": low})).summary_frame()
    ax1.fill_between(prep, pred.mean_ci_lower, pred.mean_ci_upper, color=c, alpha=0.15, lw=0)
    ax1.plot(prep, pred["mean"], color=c, lw=2.2,
             label=f"{lab} ({low:.0f}%): slope {b['prep'] + b['prep:lowinc'] * low:+.2f}")
ax1.legend(title="Low-income pupils", loc="upper left", alignment="left")
ax1.set_ylim(0, 115)
ax1.set_xlabel("Pupils in college-prep courses (%)")
ax1.set_ylabel("Pupils above national median in math (%)")
ax1.set_title("Simple slopes of college prep at three poverty levels", fontsize=12)

# Right: Johnson–Neyman — marginal effect of college prep across low income, with 95% CI
lowinc = np.linspace(df.lowinc.min(), df.lowinc.max(), 400)
eff = b["prep"] + b["prep:lowinc"] * lowinc
se = np.sqrt(V.loc["prep", "prep"] + 2 * lowinc * V.loc["prep", "prep:lowinc"]
             + lowinc**2 * V.loc["prep:lowinc", "prep:lowinc"])
lo, hi = eff - t_crit * se, eff + t_crit * se
sig = (lo > 0) | (hi < 0)
ax2.axhline(0, color="#8E8E93", lw=1, ls="--")
ax2.fill_between(lowinc, lo, hi, where=sig, color="#007AFF", alpha=0.18, lw=0, label="p < .05")
ax2.fill_between(lowinc, lo, hi, where=~sig, color="#AEAEB2", alpha=0.3, lw=0, label="n.s.")
ax2.plot(lowinc, eff, color="#1D1D1F", lw=2)
jns = lowinc[1:][np.diff(sig.astype(int)) != 0]     # where significance switches
for jn in jns:
    ax2.axvline(jn, color="#007AFF", lw=1, ls=":")
    ax2.annotate(f"Johnson–Neyman point\n{jn:.0f}% low-income", (jn, 0.97), xytext=(-8, 0),
                 xycoords=ax2.get_xaxis_transform(), textcoords="offset points",
                 fontsize=9.5, color="#007AFF", va="top", ha="right")
# Rug of the observed moderator values
ax2.plot(df.lowinc, np.full(len(df), 0.015), "|", ms=7, color="#8E8E93", alpha=0.4,
         transform=ax2.get_xaxis_transform())
share = (df.lowinc < jns[0]).mean()
ax2.legend(loc="lower left", bbox_to_anchor=(0, 0.06))
ax2.set_xlabel("Low-income pupils (moderator, %)")
ax2.set_ylabel("Math points per +1 point of college prep")
ax2.set_title(f"Significantly positive below {jns[0]:.0f}% low-income ({share:.0%} of districts)", fontsize=12)

# Figure title and statistical subtitle above both panels
p_int = model.pvalues["prep:lowinc"]
p_txt = "p < .001" if p_int < 0.001 else f"p = {p_int:.3f}"
fig.text(0.01, 1.07, "College-prep courses go with better math results, but not in poorer districts",
         fontsize=15, fontweight="semibold", va="bottom")
fig.text(0.01, 1.02, f"OLS · n = {int(model.nobs)} districts · college prep × low income: β = {b['prep:lowinc']:.4f}, "
         f"t({model.df_resid:.0f}) = {model.tvalues['prep:lowinc']:.2f}, "
         f"{p_txt} · R² = {model.rsquared:.2f} · bands = 95% CI",
         fontsize=9.5, color="#6E6E73", va="bottom")
plt.show()
图表使用了可选的 PyStatlas 样式:添加 plt.style.use("pystatlas.mplstyle") 即可完全还原其外观。
数据来源
- California STAR test results, 1998 (303 school districts). Gill, J. (2001). Generalized Linear Models: A Unified Approach (Quantitative Applications in the Social Sciences, No. 134). Sage. https://www.statsmodels.org/stable/datasets/generated/star98.html
Original data from the California Department of Education's Standardized Testing and Reporting (STAR) program, 1998. Subset distributed with statsmodels (sm.datasets.star98) with the author's permission.
这些示例用于说明统计方法。图表标题描述的是该图在这些特定数据中呈现的内容——这些数据往往样本较小、年代较早或并不完整——而不是作者对实质问题的立场。关于解释、背景和数据质量,请以此处引用的原始来源为准。
如何引用
PyStatlas 由 Thierry Warin 创建并维护。如果它对你的工作有所帮助,敬请引用。
Warin, T. (2026). Interaction effects. In PyStatlas: A Python Gallery of Statistical Graphics for the Social Sciences. https://warint.github.io/pystatlas/regression-models/interaction-effects/
@misc{warin2026statlas,
  author       = {Warin, Thierry},
  title        = {PyStatlas: A Python Gallery of Statistical Graphics for the Social Sciences},
  year         = {2026},
  howpublished = {\url{https://warint.github.io/pystatlas/}},
  note         = {Source code: https://github.com/warint/pystatlas}
}