带密度曲线的直方图
直方图、核密度和拟合的正态曲线,并附形态统计量。
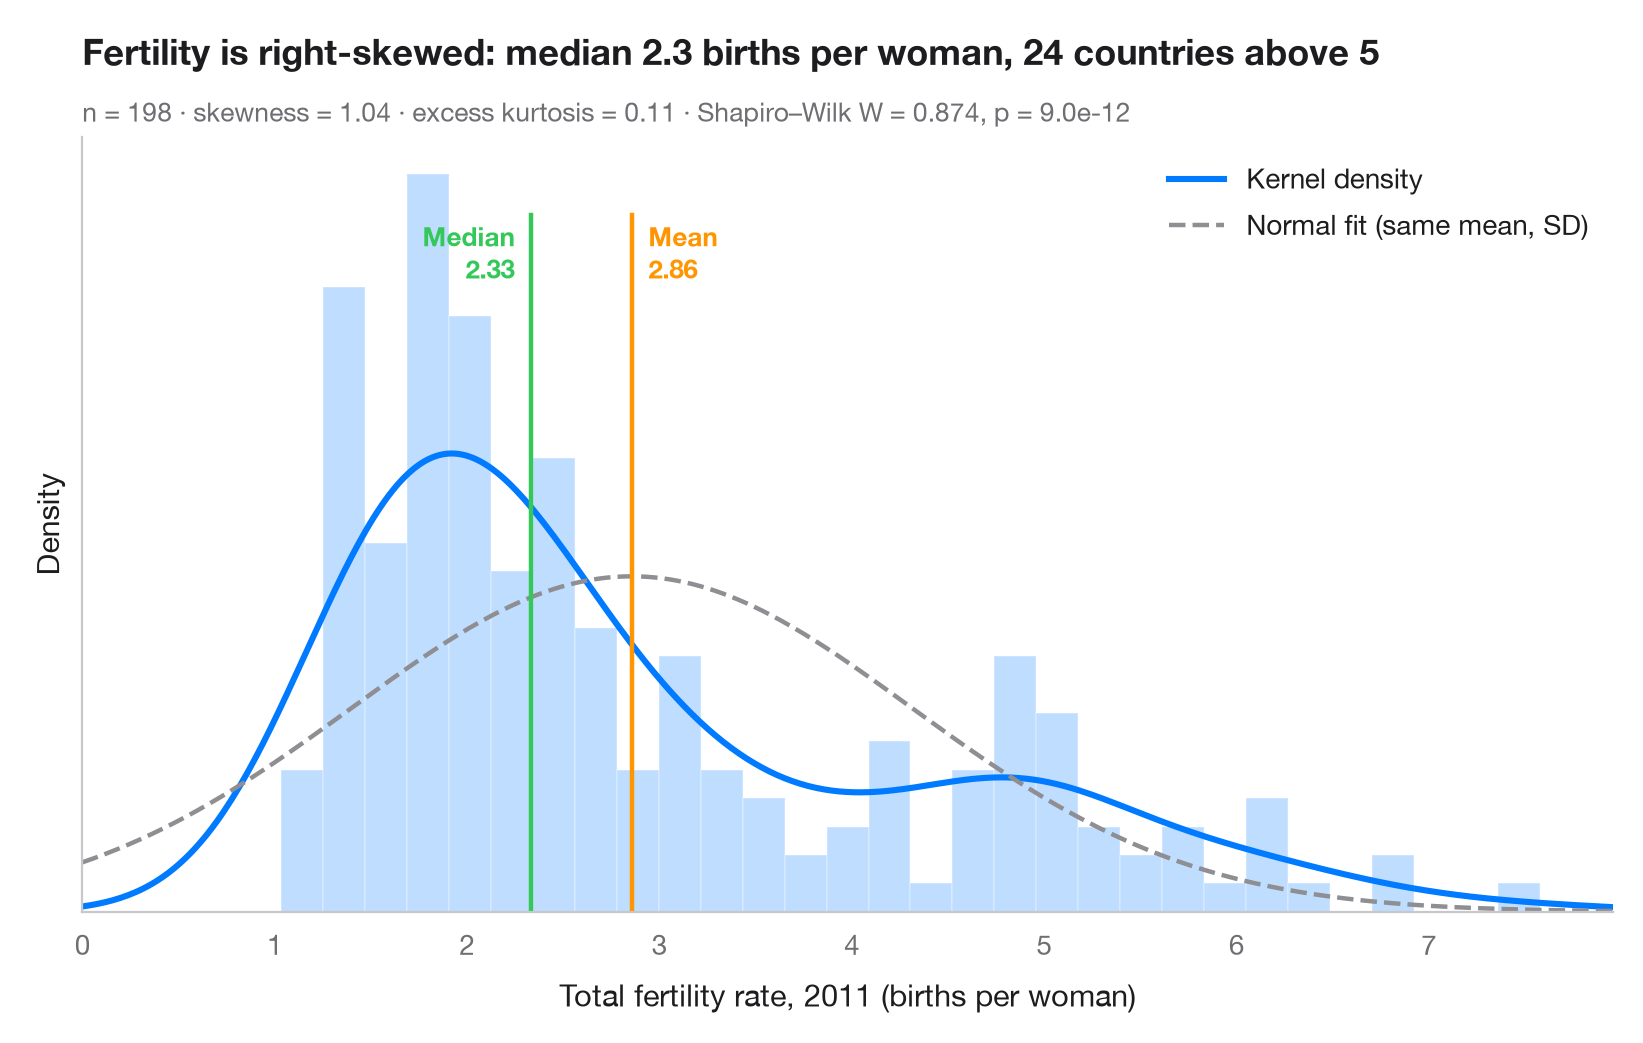
这是审视任何连续变量的第一步。柱形以密度刻度展示经验分布,实线是核密度估计(KDE),虚线是均值和标准差相同的正态分布。两条曲线不一致时,说明数据并非正态——此处高生育率国家构成的长长右尾把均值拉到了中位数之上。
数据为世界银行的总和生育率(每名妇女生育的子女数),取自 sm.datasets.fertility(statsmodels)中可用的最新年份 2011 年,涵盖 198 个国家和地区;已剔除五个区域汇总值。scipy.stats.gaussian_kde 绘制密度,scipy.stats.skew / kurtosis 描述形态,scipy.stats.shapiro 检验正态性。
代码及图中文字均为英文。
import matplotlib.pyplot as plt
import numpy as np
import statsmodels.api as sm
from scipy import stats

# Data: total fertility rate (births per woman) of each country in 2011
wb = sm.datasets.fertility.load_pandas().data
wb = wb[~wb["Country Name"].str.contains("classification|income levels|members|small states")]  # 5 aggregates
x = wb["2011"].dropna().to_numpy()
mean, median, sd = x.mean(), np.median(x), x.std(ddof=1)

# Shape statistics and normality test
skew, kurt = stats.skew(x), stats.kurtosis(x)  # kurtosis: excess, 0 for a normal
W, p = stats.shapiro(x)

fig, ax = plt.subplots(figsize=(8, 5))
ax.hist(x, bins=30, density=True, color="#007AFF", alpha=0.25, edgecolor="white")

# Kernel density estimate and the normal curve with the same mean / SD
grid = np.linspace(0, x.max() * 1.05, 400)
ax.plot(grid, stats.gaussian_kde(x)(grid), color="#007AFF", lw=2.2, label="Kernel density")
ax.plot(grid, stats.norm.pdf(grid, mean, sd), color="#8E8E93", lw=1.6, ls="--",
        label="Normal fit (same mean, SD)")

# Mean and median markers
ymax = ax.get_ylim()[1]
for value, name, color, ha, dx in [(mean, "Mean", "#FF9500", "left", 6),
                                   (median, "Median", "#34C759", "right", -6)]:
    ax.axvline(value, color=color, lw=1.6, ymax=0.9)
    ax.annotate(f"{name}\n{value:.2f}", (value, ymax * 0.9), xytext=(dx, -2),
                textcoords="offset points", ha=ha, va="top", fontsize=9.5,
                fontweight="semibold", color=color)

ax.set_xlim(0, grid[-1])
ax.set_yticks([])
ax.set_ylabel("Density")
ax.set_xlabel("Total fertility rate, 2011 (births per woman)")
ax.legend(loc="upper right")
ax.set_title(f"Fertility is right-skewed: median {median:.1f} births per woman, "
             f"{(x > 5).sum()} countries above 5", pad=26)
ax.text(0, 1.02, f"n = {len(x)} · skewness = {skew:.2f} · excess kurtosis = {kurt:.2f} · "
        f"Shapiro–Wilk W = {W:.3f}, p = {p:.1e}", transform=ax.transAxes,
        fontsize=9.5, color="#6E6E73")
plt.show()
图表使用了可选的 PyStatlas 样式:添加 plt.style.use("pystatlas.mplstyle") 即可完全还原其外观。
数据来源
- World Bank fertility rates by country, 1960–2013. World Bank. Fertility rate, total (births per woman), indicator SP.DYN.TFRT.IN. World Development Indicators. https://data.worldbank.org/indicator/SP.DYN.TFRT.IN
Primary sources: UN Population Division, UN Statistical Division, national statistical offices, Eurostat and others. Distributed with statsmodels (sm.datasets.fertility) under the World Bank terms of use.
这些示例用于说明统计方法。图表标题描述的是该图在这些特定数据中呈现的内容——这些数据往往样本较小、年代较早或并不完整——而不是作者对实质问题的立场。关于解释、背景和数据质量,请以此处引用的原始来源为准。
如何引用
PyStatlas 由 Thierry Warin 创建并维护。如果它对你的工作有所帮助,敬请引用。
Warin, T. (2026). Histogram with density. In PyStatlas: A Python Gallery of Statistical Graphics for the Social Sciences. https://warint.github.io/pystatlas/distributions/histogram-density/
@misc{warin2026statlas,
  author       = {Warin, Thierry},
  title        = {PyStatlas: A Python Gallery of Statistical Graphics for the Social Sciences},
  year         = {2026},
  howpublished = {\url{https://warint.github.io/pystatlas/}},
  note         = {Source code: https://github.com/warint/pystatlas}
}