Predicted probabilities
Model-based probability curves with 95% CI ribbons across a predictor, by group.
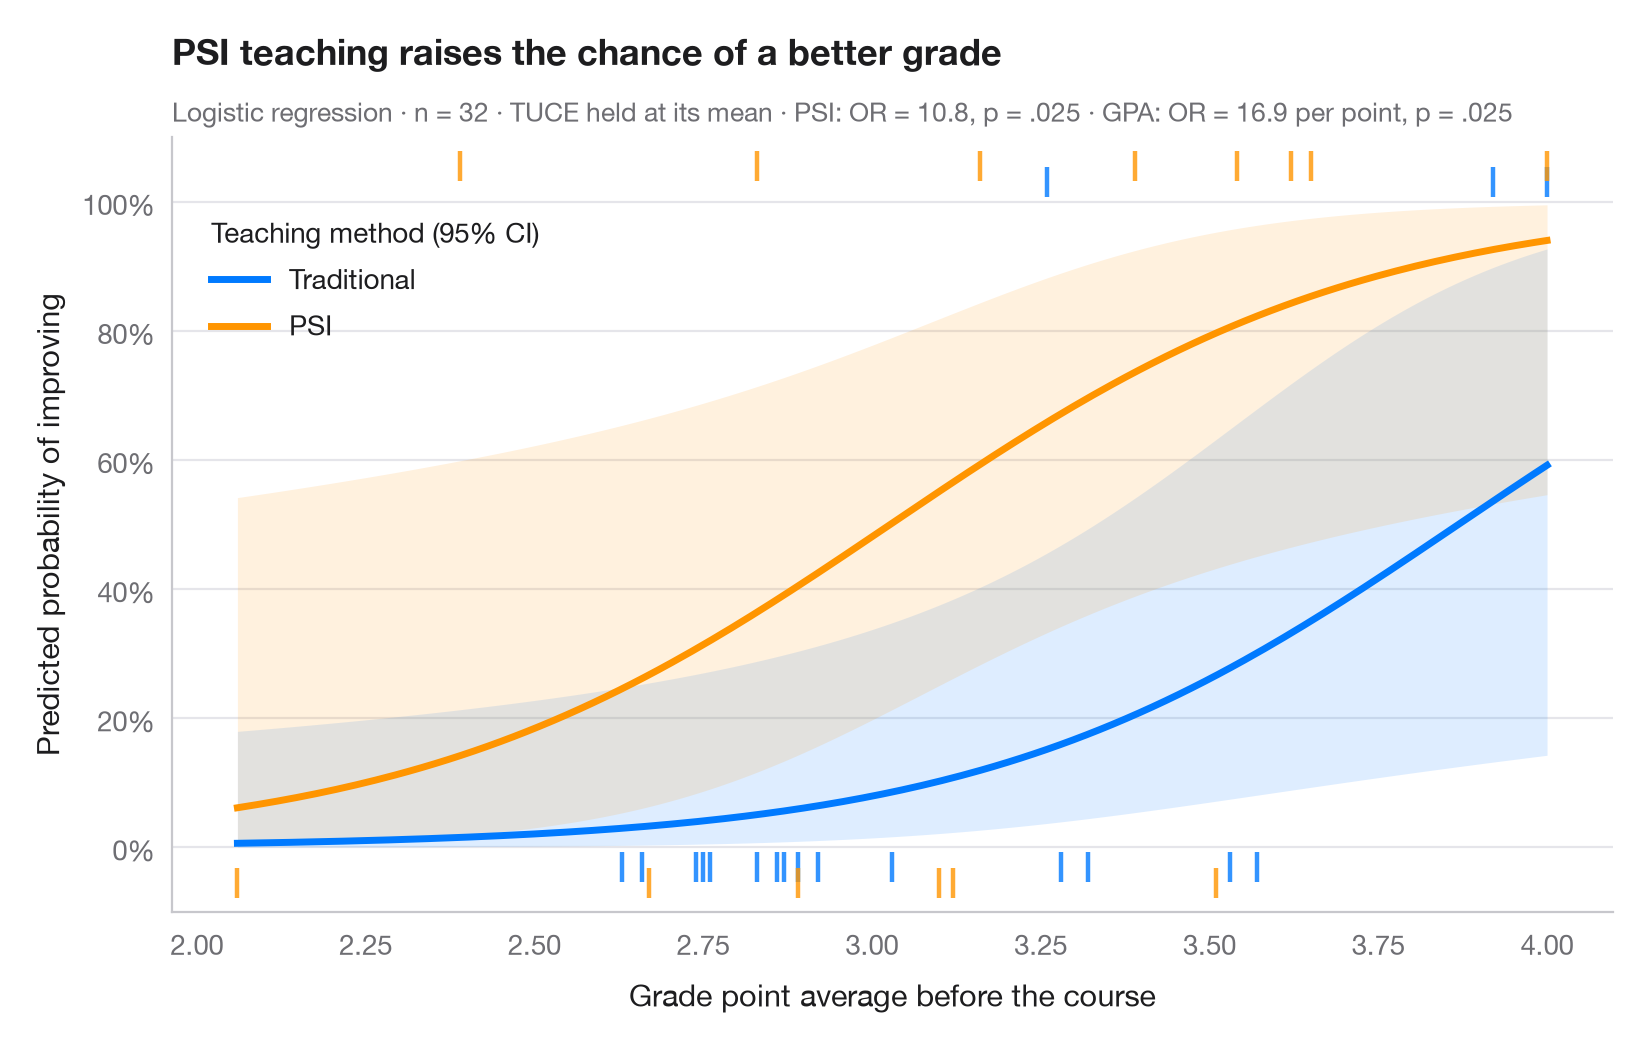
Odds ratios are hard to feel; probabilities are not. This chart turns a logistic model back into the outcome scale: each curve is the predicted probability of success across the range of a continuous predictor, for one level of a factor, with the other covariates held at their mean. Ribbons are 95% confidence intervals computed on the logit scale and back-transformed, so they stay inside [0, 1]. Rugs show the observed students — at the top if they improved, at the bottom if they did not.
Data are Spector & Mazzeo's (1980) experiment bundled with statsmodels
(sm.datasets.spector): did a new teaching method (PSI) raise grades, given
prior GPA and a pre-test score (TUCE)? The model is a binomial smf.glm(); the
curves come from get_prediction().summary_frame().
import matplotlib.pyplot as plt
import numpy as np
import pandas as pd
import statsmodels.api as sm
import statsmodels.formula.api as smf

# Data: 32 students; GRADE = 1 if the grade improved after the course
df = sm.datasets.spector.load_pandas().data
model = smf.glm("GRADE ~ GPA + TUCE + C(PSI)", data=df, family=sm.families.Binomial()).fit()

# Prediction grid: GPA across its range, TUCE at its mean, both teaching methods
gpa = np.linspace(df.GPA.min(), df.GPA.max(), 200)
groups = {0: ("Traditional", "#007AFF"), 1: ("PSI", "#FF9500")}

fig, ax = plt.subplots(figsize=(8, 5))
for level, (name, c) in groups.items():
    grid = pd.DataFrame({"GPA": gpa, "TUCE": df.TUCE.mean(), "PSI": level})
    pred = model.get_prediction(grid).summary_frame(alpha=0.05)
    ax.fill_between(gpa, pred.mean_ci_lower, pred.mean_ci_upper, color=c, alpha=0.13, lw=0)
    ax.plot(gpa, pred["mean"], color=c, lw=2.5, label=name)
    # Rug of observations: improved (top) or not (bottom), slightly offset per group
    obs = df[df.PSI == level]
    y_rug = np.where(obs.GRADE == 1, 1.03 + 0.025 * level, -0.03 - 0.025 * level)
    ax.scatter(obs.GPA, y_rug, marker="|", s=110, lw=1.6, color=c, alpha=0.8, clip_on=False)

ax.legend(loc="upper left", title="Teaching method (95% CI)", alignment="left",
          bbox_to_anchor=(0.01, 0.93))
ax.set_ylim(-0.1, 1.1)
ax.set_yticks(np.linspace(0, 1, 6), [f"{v:.0%}" for v in np.linspace(0, 1, 6)])
ax.set_xlabel("Grade point average before the course")
ax.set_ylabel("Predicted probability of improving")
ax.set_title("PSI teaching raises the chance of a better grade", pad=26)
psi = "C(PSI)[T.1.0]"
fmt_p = lambda p: f"{p:.3f}".lstrip("0")
ax.text(0, 1.02, f"Logistic regression · n = {int(model.nobs)} · TUCE held at its mean · "
        f"PSI: OR = {np.exp(model.params[psi]):.1f}, p = {fmt_p(model.pvalues[psi])} · "
        f"GPA: OR = {np.exp(model.params['GPA']):.1f} per point, p = {fmt_p(model.pvalues['GPA'])}",
        transform=ax.transAxes, fontsize=9.5, color="#6E6E73")
plt.show()
Figures use the optional PyStatlas style: add plt.style.use("pystatlas.mplstyle") to match the look exactly.
Data source
- Spector and Mazzeo's teaching-method experiment (32 students). Spector, L. C., & Mazzeo, M. (1980). Probit analysis and economic education. Journal of Economic Education, 11(2), 37–44. https://www.statsmodels.org/stable/datasets/generated/spector.html
Obtained from W. Greene's Econometric Analysis web site with the original author's permission; distributed with statsmodels (sm.datasets.spector).
The examples illustrate statistical methods. Their titles describe what each figure shows in these particular data — often a small, dated or partial sample — not the author's position on the substantive question. For interpretation, context and data quality, rely on the original sources cited here.
How to cite
PyStatlas is created and maintained by Thierry Warin. If it helped your work, please cite it.
Warin, T. (2026). Predicted probabilities. In PyStatlas: A Python Gallery of Statistical Graphics for the Social Sciences. https://warint.github.io/pystatlas/regression-models/predicted-probabilities/
@misc{warin2026statlas,
  author       = {Warin, Thierry},
  title        = {PyStatlas: A Python Gallery of Statistical Graphics for the Social Sciences},
  year         = {2026},
  howpublished = {\url{https://warint.github.io/pystatlas/}},
  note         = {Source code: https://github.com/warint/pystatlas}
}More in Regression models
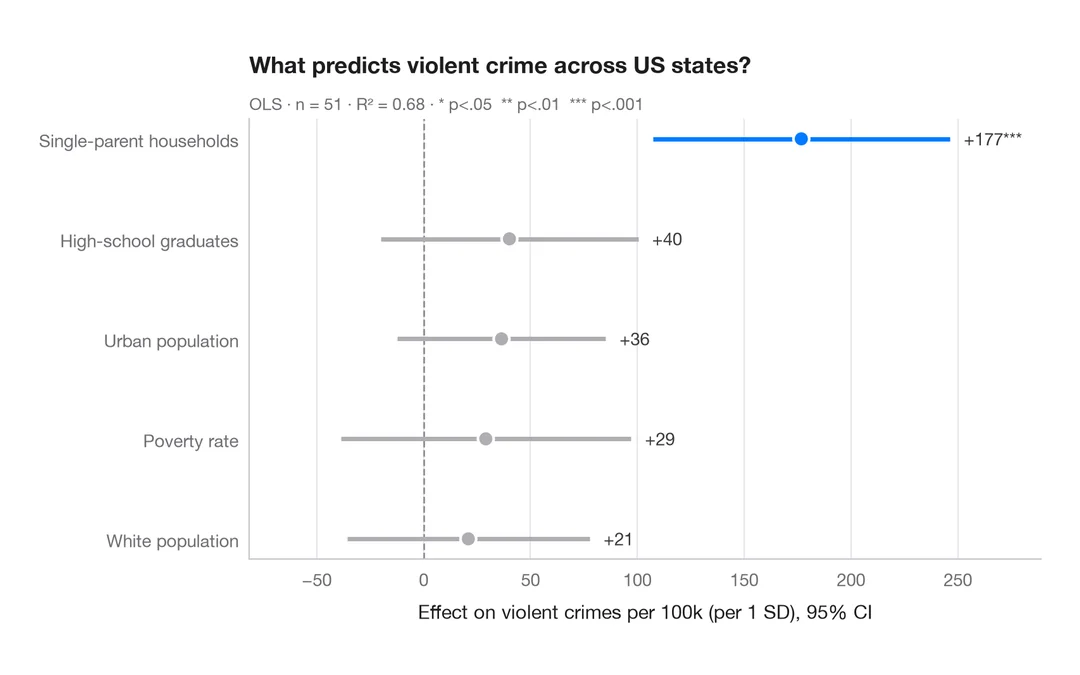
Coefficient plot
Regression estimates with 95% confidence intervals, one row per term.
ggstats::ggcoef_model()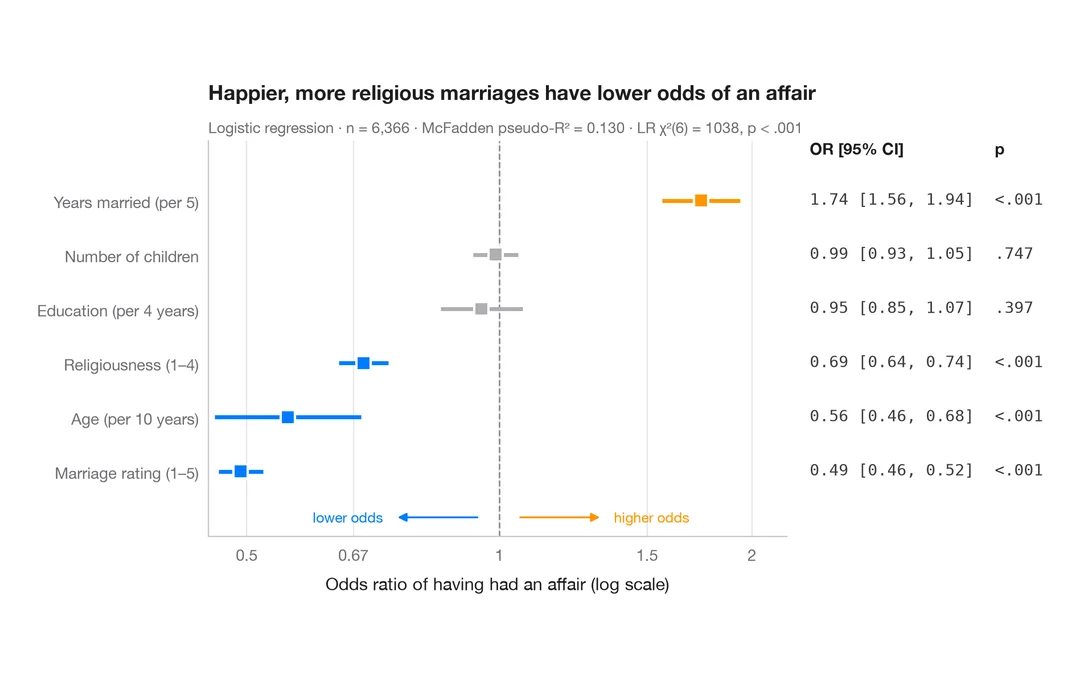
Odds-ratio forest plot
Logistic regression odds ratios on a log scale, with a table of OR [95% CI] alongside.
ggstats::ggcoef_model(exponentiate = TRUE)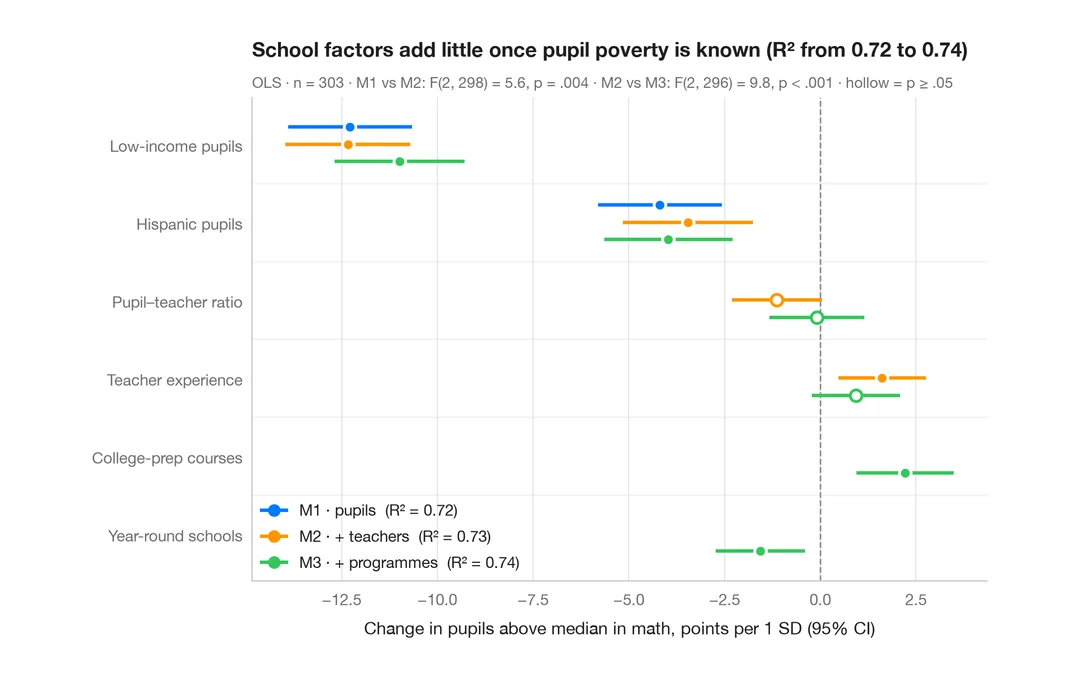
Comparing nested models
Coefficients of three nested regressions of district math results side by side, to see how estimates shift as blocks are added.
ggstats::ggcoef_compare()