Coefficient plot
Regression estimates with 95% confidence intervals, one row per term.
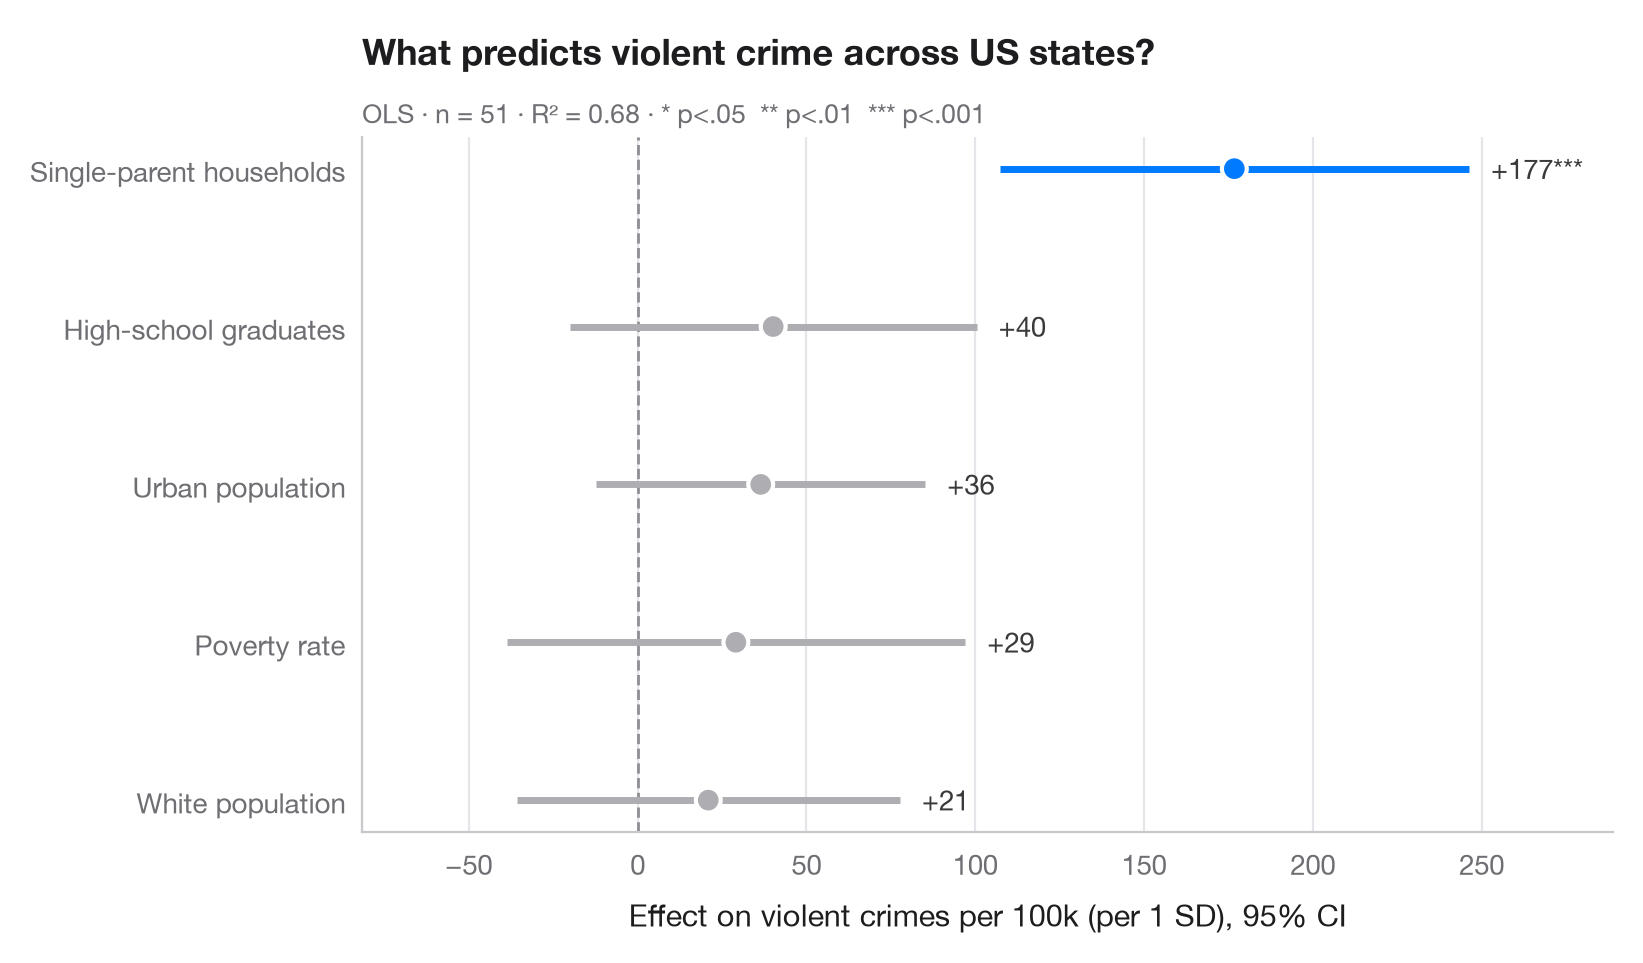
A coefficient plot (a.k.a. dot-and-whisker plot) replaces the regression table. Each point is an estimate, each line its 95% confidence interval, and the dashed line marks zero. Terms whose interval crosses zero are drawn in grey, so the significant effects stand out at a glance.
The model explains the violent-crime rate of the 50 US states (+ DC) with the statsmodels formula API. Predictors are standardised first, so the coefficients are directly comparable: change in crimes per 100,000 people for a one-standard-deviation change in the predictor.
import matplotlib.pyplot as plt
import numpy as np
import statsmodels.api as sm
import statsmodels.formula.api as smf

# Data: US state crime rates (bundled with statsmodels)
df = sm.datasets.statecrime.load_pandas().data
predictors = ["poverty", "single", "urban", "hs_grad", "white"]
df[predictors] = (df[predictors] - df[predictors].mean()) / df[predictors].std()

model = smf.ols("violent ~ " + " + ".join(predictors), data=df).fit()

# Tidy the results: estimate, 95% CI and p-value per term (intercept dropped)
ci = model.conf_int().drop("Intercept")
coefs = (
    ci.assign(estimate=model.params, p=model.pvalues)
      .rename(columns={0: "low", 1: "high"})
      .sort_values("estimate")
)
labels = {"poverty": "Poverty rate", "single": "Single-parent households",
          "urban": "Urban population", "hs_grad": "High-school graduates",
          "white": "White population"}

fig, ax = plt.subplots(figsize=(8, 4.6))
y = np.arange(len(coefs))
colors = np.where(coefs["p"] < 0.05, "#007AFF", "#AEAEB2")

ax.axvline(0, color="#8E8E93", lw=1, ls="--", zorder=1)
ax.hlines(y, coefs["low"], coefs["high"], color=colors, lw=2.5, zorder=2)
ax.scatter(coefs["estimate"], y, s=80, color=colors, edgecolor="white", lw=1.5, zorder=3)

for yi, (_, row) in zip(y, coefs.iterrows()):
    stars = "***" if row.p < .001 else "**" if row.p < .01 else "*" if row.p < .05 else ""
    ax.annotate(f"{row.estimate:+.0f}{stars}", (row.high, yi), xytext=(8, 0),
                textcoords="offset points", va="center", fontsize=10, color="#3A3A3C")

ax.set_yticks(y, [labels[t] for t in coefs.index])
ax.grid(axis="x"); ax.grid(axis="y", visible=False)
ax.set_xlabel("Effect on violent crimes per 100k (per 1 SD), 95% CI")
ax.set_title("What predicts violent crime across US states?", pad=26)
ax.text(0, 1.02, f"OLS · n = {int(model.nobs)} · R² = {model.rsquared:.2f} · "
        "* p<.05  ** p<.01  *** p<.001", transform=ax.transAxes,
        fontsize=9.5, color="#6E6E73")
ax.margins(x=0.15)
plt.show()
Figures use the optional PyStatlas style: add plt.style.use("pystatlas.mplstyle") to match the look exactly.
Data source
- US state crime and social indicators, 2009. U.S. Census Bureau. Statistical Abstract of the United States, state tables for 2009 (crime rates from the FBI Uniform Crime Reporting program). https://www.statsmodels.org/stable/datasets/generated/statecrime.html
Compiled for statsmodels (sm.datasets.statecrime); public domain. See the statsmodels page for each variable's table and footnotes.
The examples illustrate statistical methods. Their titles describe what each figure shows in these particular data — often a small, dated or partial sample — not the author's position on the substantive question. For interpretation, context and data quality, rely on the original sources cited here.
How to cite
PyStatlas is created and maintained by Thierry Warin. If it helped your work, please cite it.
Warin, T. (2026). Coefficient plot. In PyStatlas: A Python Gallery of Statistical Graphics for the Social Sciences. https://warint.github.io/pystatlas/regression-models/coefficient-plot/
@misc{warin2026statlas,
  author       = {Warin, Thierry},
  title        = {PyStatlas: A Python Gallery of Statistical Graphics for the Social Sciences},
  year         = {2026},
  howpublished = {\url{https://warint.github.io/pystatlas/}},
  note         = {Source code: https://github.com/warint/pystatlas}
}More in Regression models
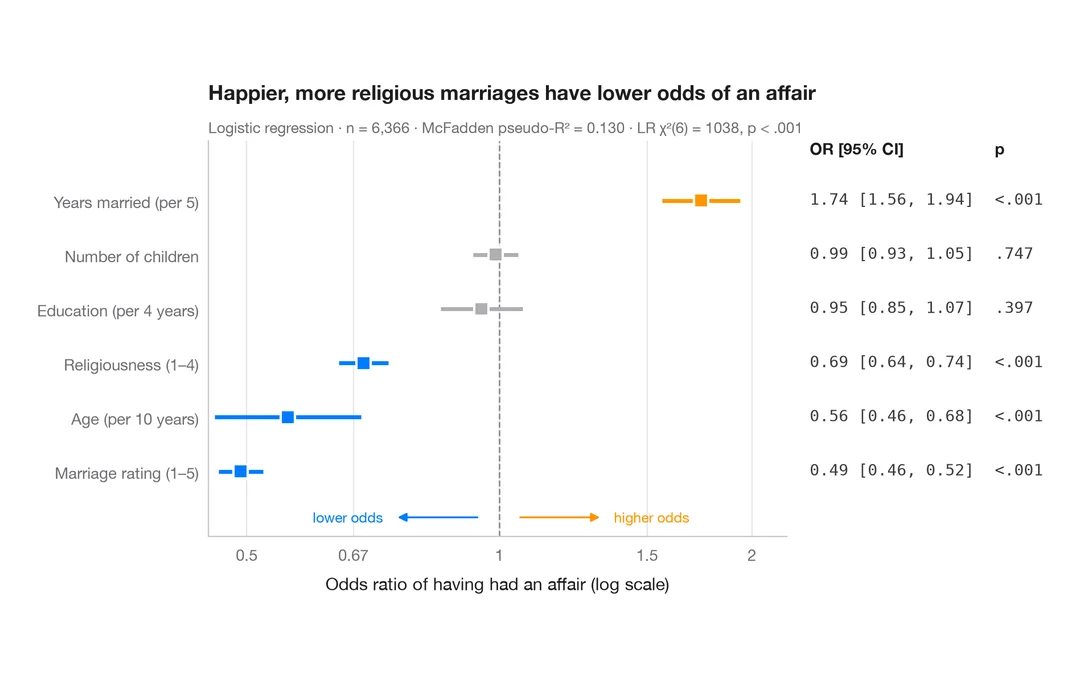
Odds-ratio forest plot
Logistic regression odds ratios on a log scale, with a table of OR [95% CI] alongside.
ggstats::ggcoef_model(exponentiate = TRUE)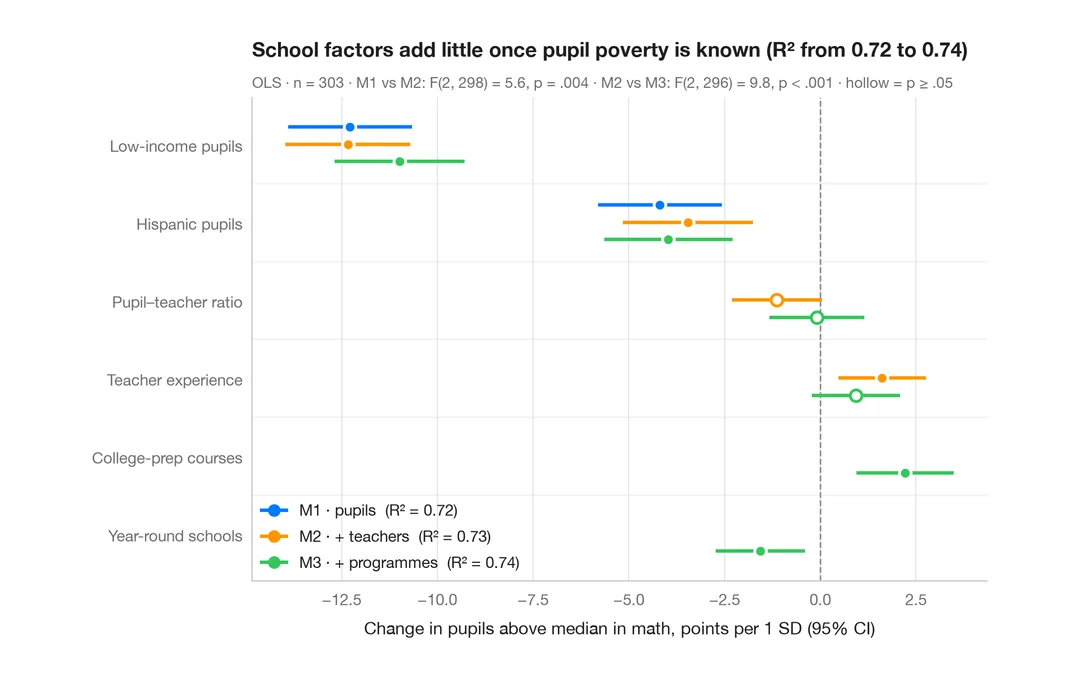
Comparing nested models
Coefficients of three nested regressions of district math results side by side, to see how estimates shift as blocks are added.
ggstats::ggcoef_compare()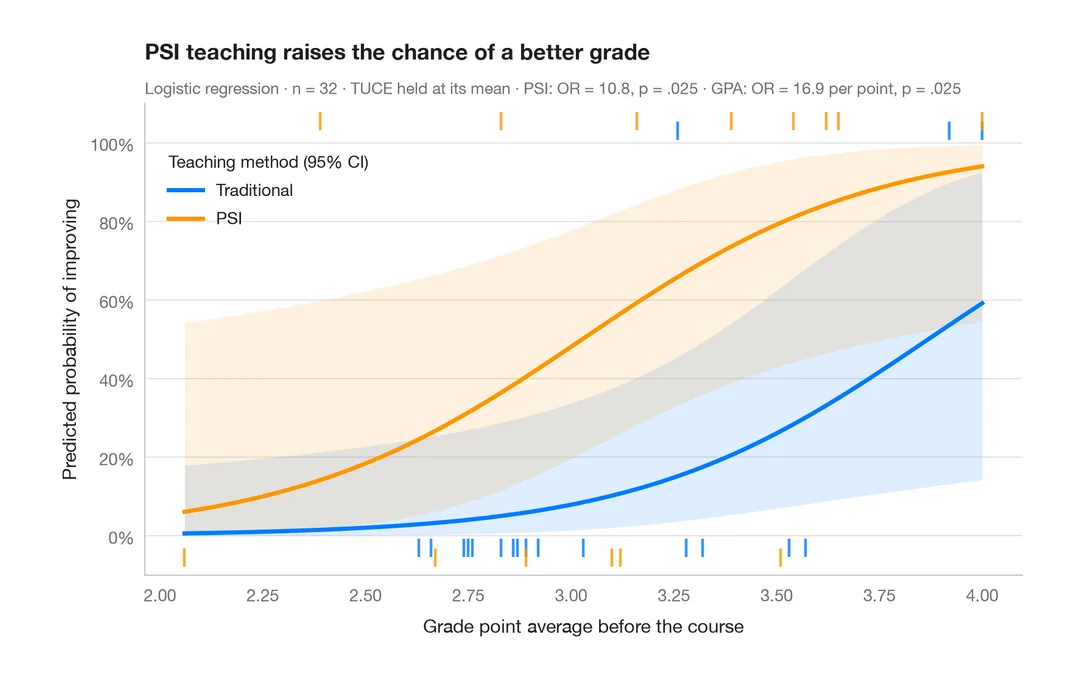
Predicted probabilities
Model-based probability curves with 95% CI ribbons across a predictor, by group.
ggeffects::ggpredict() / marginaleffects::plot_predictions()