Gallery/Regression models
Regression models
Coefficient plots, odds ratios, model comparison and marginal effects — ggcoef_model for Python.
Regression models
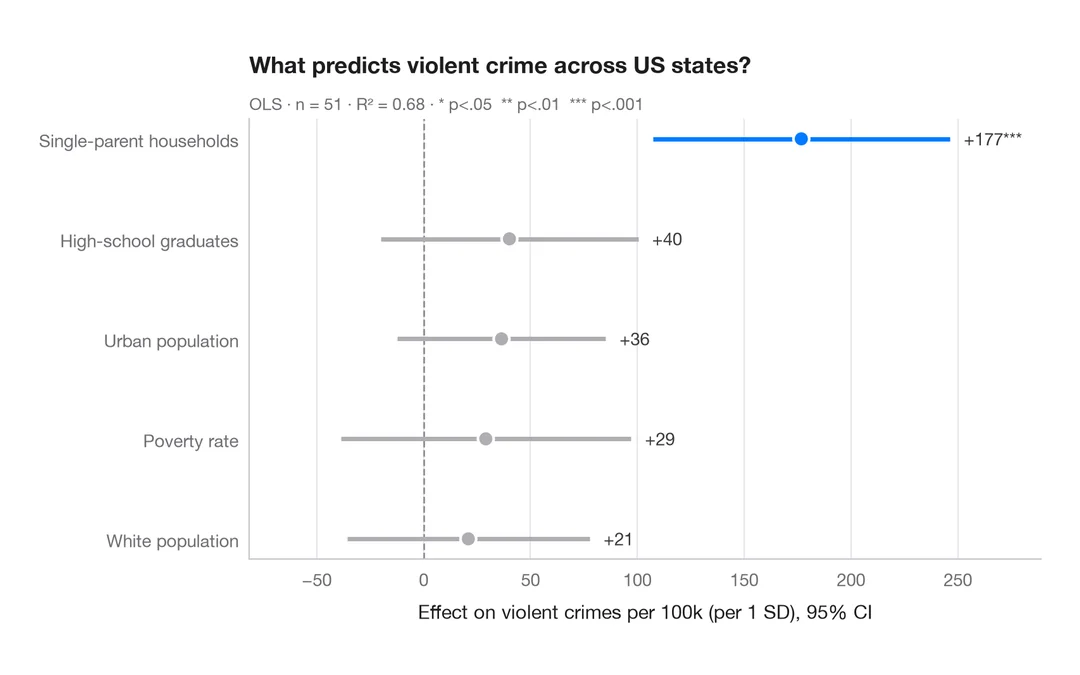
Coefficient plot
Regression estimates with 95% confidence intervals, one row per term.
ggstats::ggcoef_model()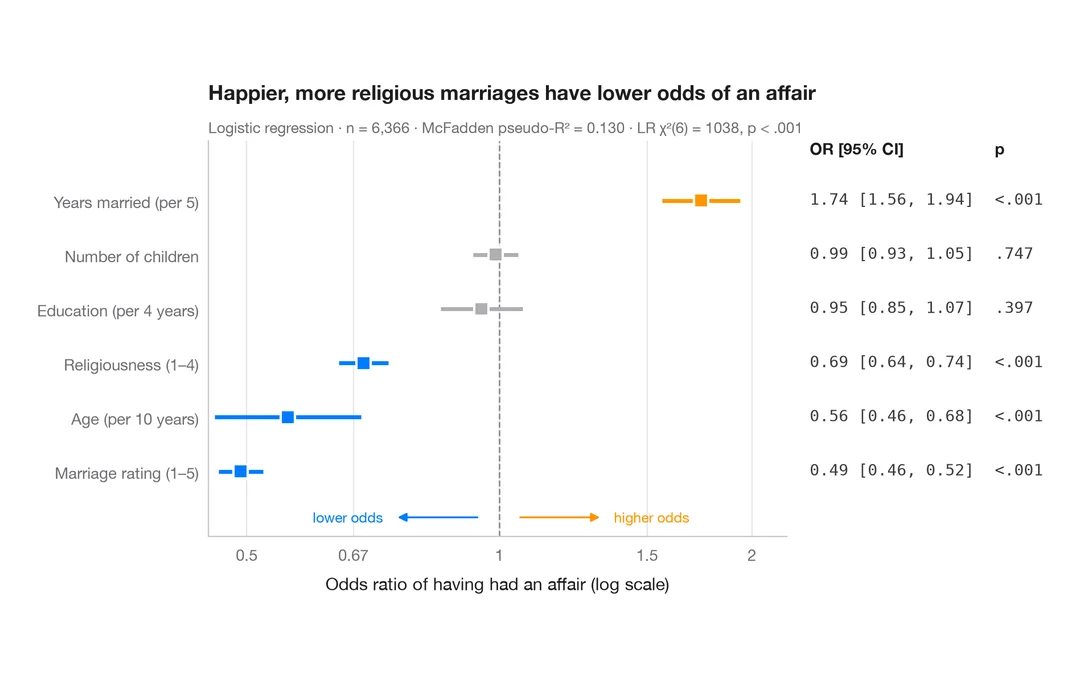
Regression models
Odds-ratio forest plot
Logistic regression odds ratios on a log scale, with a table of OR [95% CI] alongside.
ggstats::ggcoef_model(exponentiate = TRUE)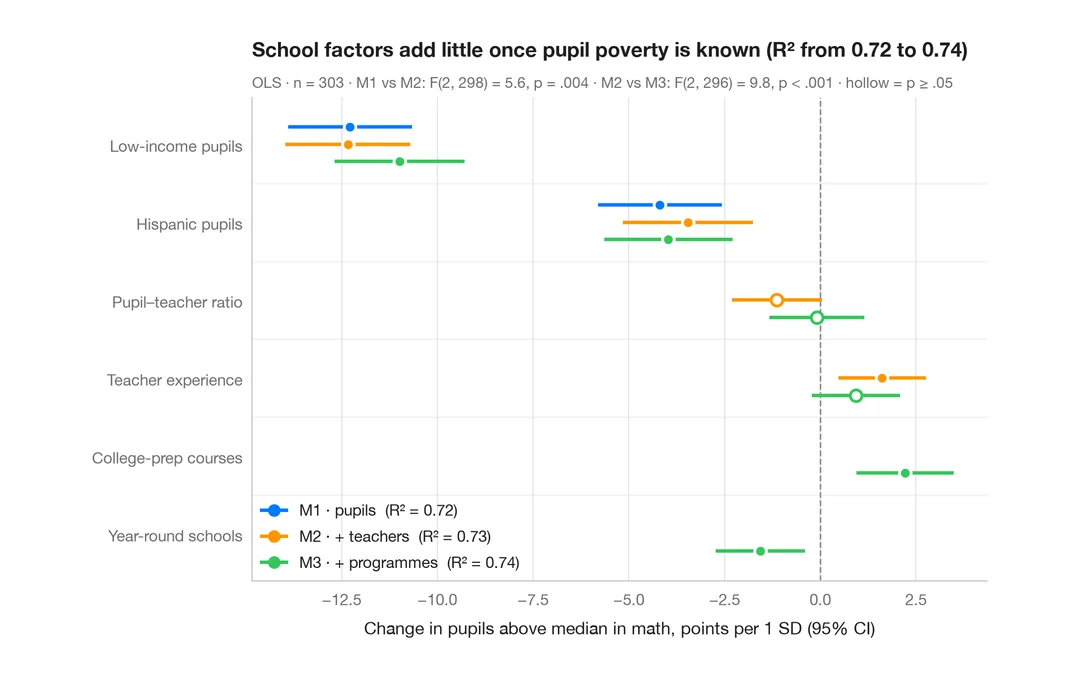
Regression models
Comparing nested models
Coefficients of three nested regressions of district math results side by side, to see how estimates shift as blocks are added.
ggstats::ggcoef_compare()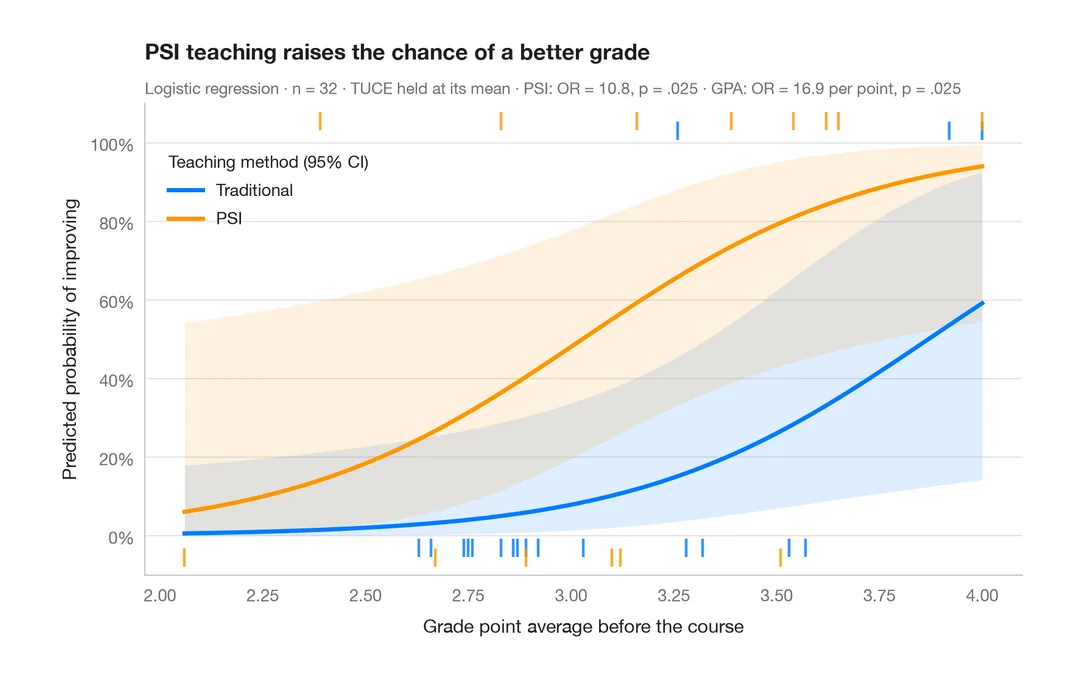
Regression models
Predicted probabilities
Model-based probability curves with 95% CI ribbons across a predictor, by group.
ggeffects::ggpredict() / marginaleffects::plot_predictions()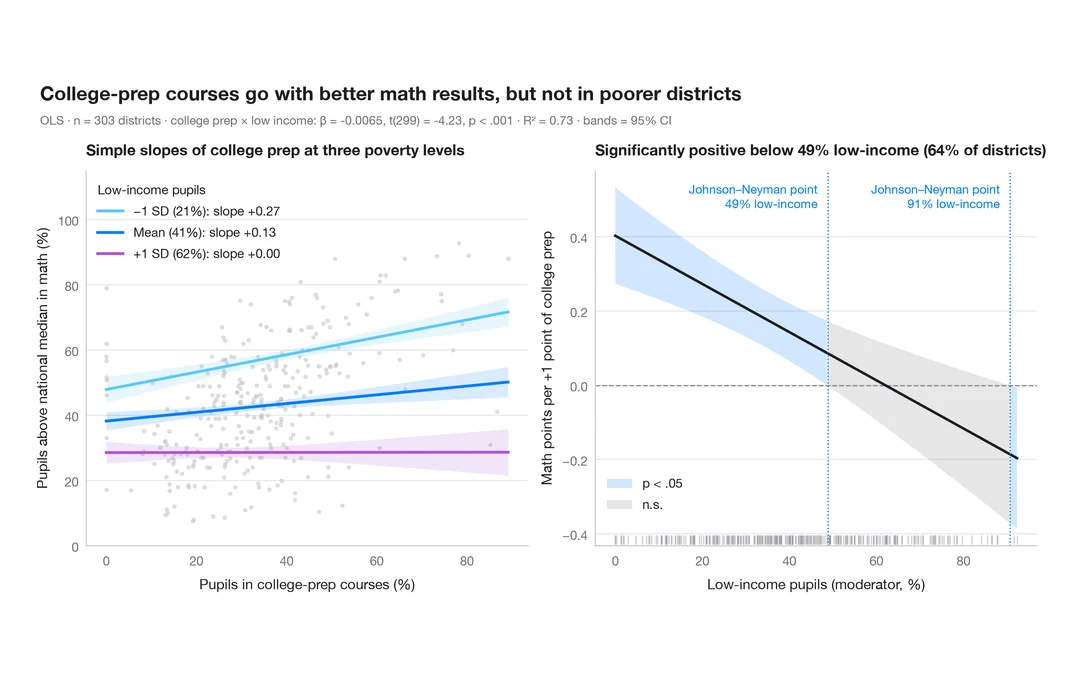
Regression models
Interaction effects
Simple slopes at mean ± 1 SD and a Johnson–Neyman plot for college-prep courses and math results, moderated by pupil poverty.
interactions::interact_plot() / interactions::johnson_neyman()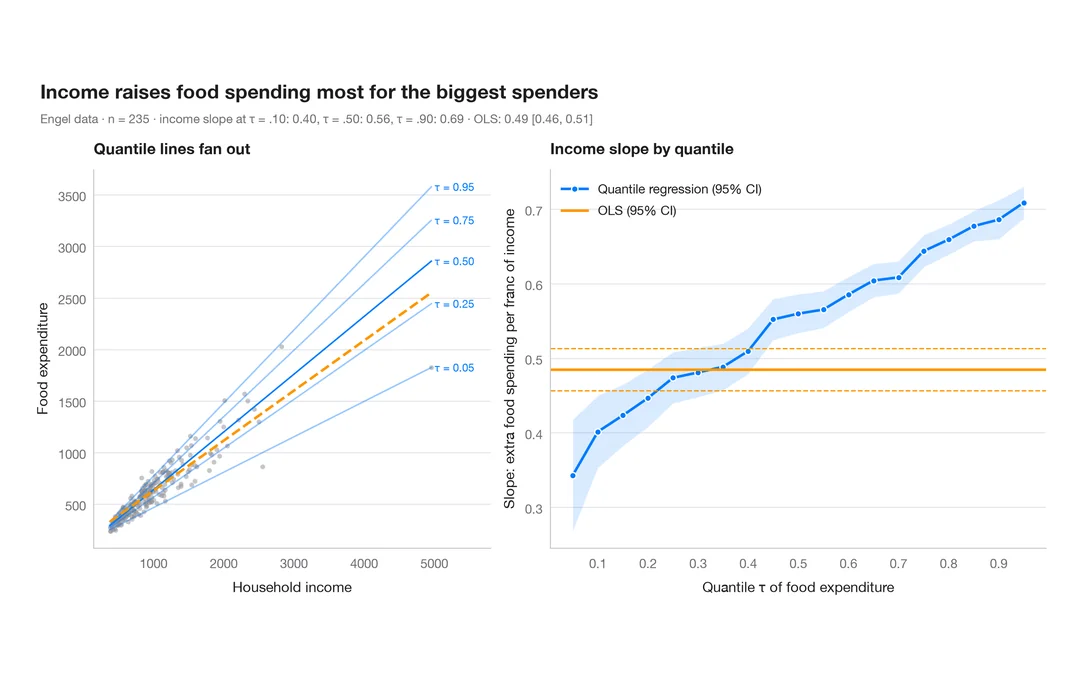
Regression models
Quantile regression process
How a slope changes across the conditional distribution, against the single OLS estimate.
quantreg::plot(summary(rq(tau = 1:19 / 20)))