SHAP waterfall for one prediction
How each characteristic moves one struggling school district's predicted maths results from the average to the model's output.
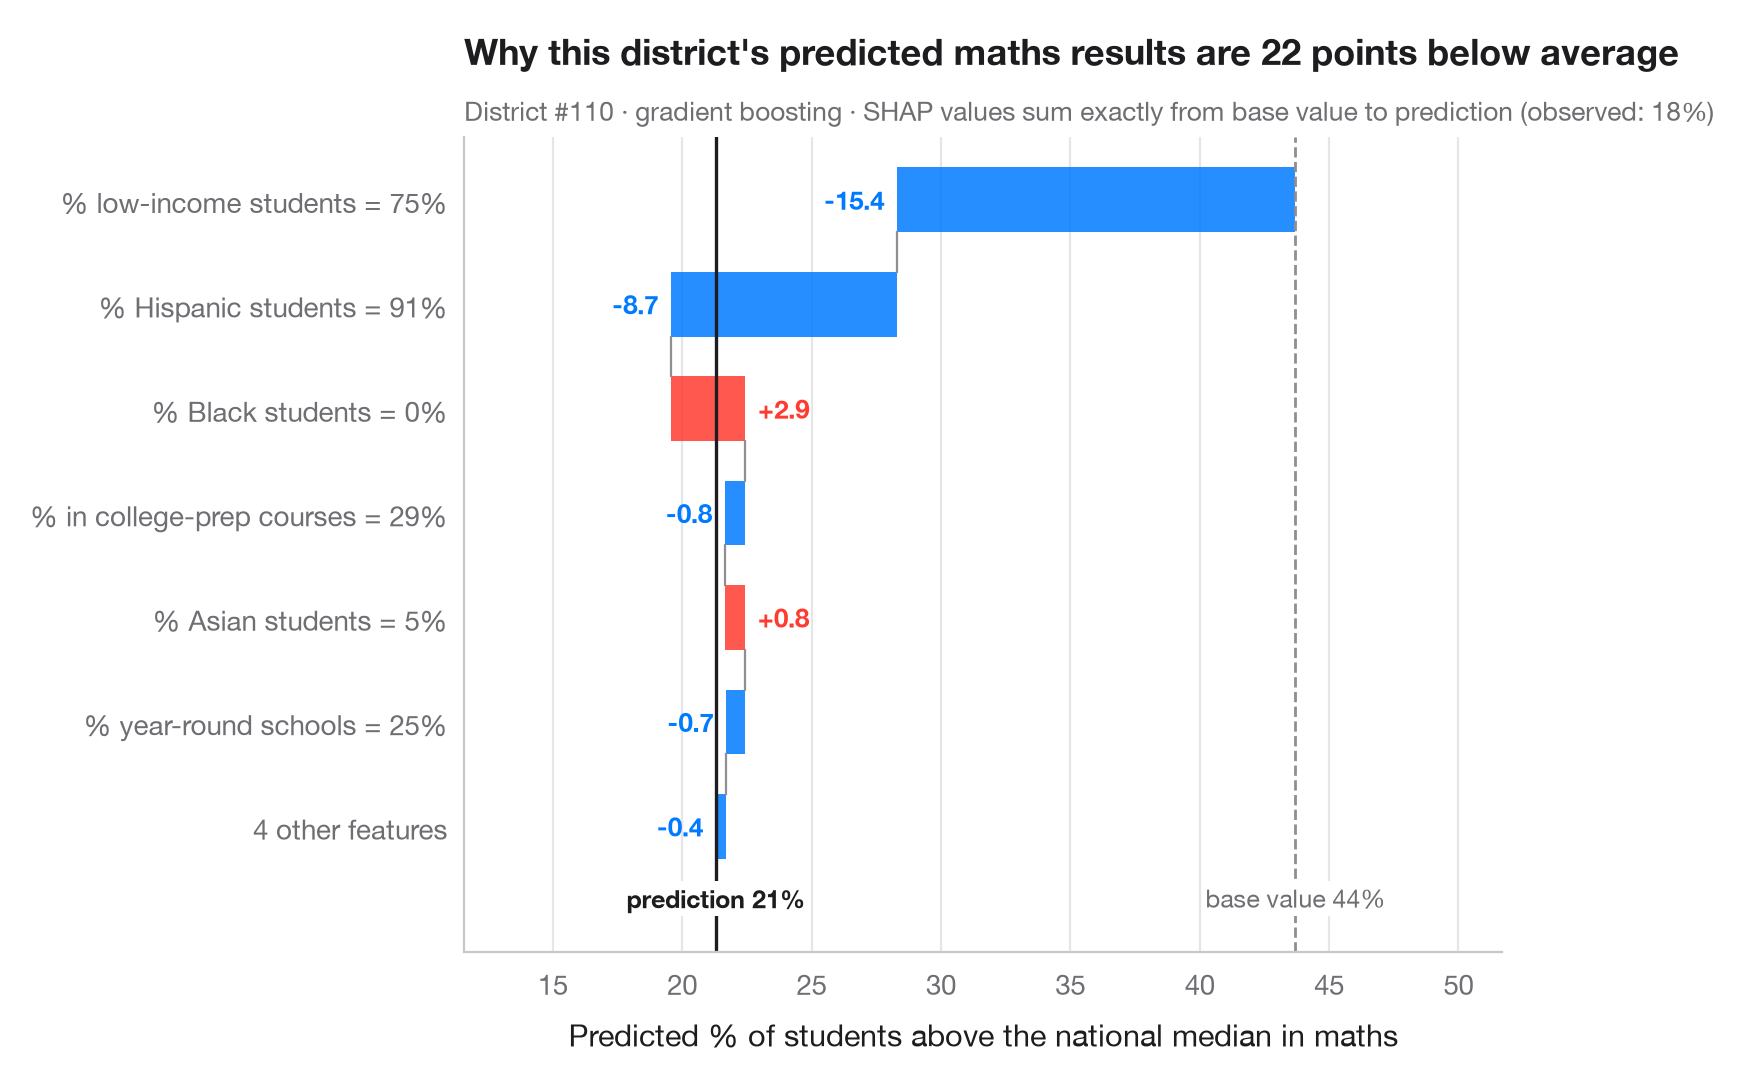
Global charts describe the model; a waterfall explains one prediction. It starts from the base value — the model's average prediction over the data — and adds each feature's SHAP value in turn, largest first, until it reaches this district's prediction. Red bars push the prediction up, blue bars pull it down; the smallest contributions are pooled into one bar so the chart stays readable. Because SHAP values are additive, the bars always sum exactly to the gap between the base value and the prediction.
This is the chart to show when a single case must be explained — a district
flagged for support, a loan, a benefit claim. It explains what the model
did, not why the outcome happens. Data are the 303 California school districts
of the 1998 STAR test bundled with statsmodels (sm.datasets.star98); the
outcome is the share of students scoring above the national median in maths,
predicted from ten district characteristics. The model is a gradient-boosting
regressor; SHAP values come from shap.TreeExplainer. The district shown is a
struggling one (predicted more than 20 points below the base value) chosen
because its explanation pulls in both directions.
import matplotlib.pyplot as plt
import numpy as np
import shap
import statsmodels.api as sm
from sklearn.ensemble import GradientBoostingRegressor

# Data: 303 California school districts; outcome = % of students above the national median in maths
d = sm.datasets.star98.load_pandas().data
y = 100 * d["NABOVE"] / (d["NABOVE"] + d["NBELOW"])
names = {"LOWINC": "% low-income students", "PERASIAN": "% Asian students", "PERBLACK": "% Black students",
         "PERHISP": "% Hispanic students", "AVYRSEXP": "Teacher experience (years)",
         "AVSALK": "Teacher salary ($000)", "PERSPENK": "Spending per pupil ($000)",
         "PTRATIO": "Pupils per teacher", "PCTAF": "% in college-prep courses",
         "PCTYRRND": "% year-round schools"}
X = d[list(names)]
fmt = {"LOWINC": "{:.0f}%", "PERASIAN": "{:.0f}%", "PERBLACK": "{:.0f}%", "PERHISP": "{:.0f}%",
       "AVYRSEXP": "{:.1f}", "AVSALK": "{:.1f}", "PERSPENK": "{:.2f}", "PTRATIO": "{:.1f}",
       "PCTAF": "{:.0f}%", "PCTYRRND": "{:.0f}%"}
model = GradientBoostingRegressor(learning_rate=0.05, n_estimators=300, max_depth=2,
                                  subsample=0.8, random_state=0).fit(X, y)

explainer = shap.TreeExplainer(model)
base = float(np.ravel(explainer.expected_value)[0])
all_sv = explainer.shap_values(X)
# A struggling district whose explanation has pushes in both directions
low = np.where(all_sv.sum(axis=1) < -20)[0]
p = int(low[np.argmax(all_sv[low].max(axis=1))])
sv = all_sv[p]

# Largest contributions first; pool the rest
k = 6
idx = np.argsort(np.abs(sv))[::-1]
top, rest = idx[:k], idx[k:]
labels = [f"{names[X.columns[j]]} = {fmt[X.columns[j]].format(X.iloc[p, j])}" for j in top]
values = list(sv[top])
if len(rest):
    labels.append(f"{len(rest)} other features")
    values.append(sv[rest].sum())

fig, ax = plt.subplots(figsize=(8, 5.2))
start = base
for i, (lab, v) in enumerate(zip(labels, values)):
    c = "#FF3B30" if v > 0 else "#007AFF"
    ax.barh(i, v, left=start, color=c, alpha=0.85, height=0.62)
    ax.text(start + v + (0.5 if v > 0 else -0.5), i, f"{v:+.1f}", va="center",
            ha="left" if v > 0 else "right", fontsize=9.5, color=c, fontweight="semibold")
    if i < len(values) - 1:
        ax.plot([start + v] * 2, [i + 0.31, i + 0.69], color="#8E8E93", lw=0.8)
    start += v
ax.axvline(base, color="#8E8E93", ls="--", lw=1)
ax.axvline(start, color="#1d1d1f", lw=1.2)
bottom = len(labels) - 0.45
ax.text(base, bottom, f"base value {base:.0f}%", ha="center", va="top", fontsize=9, color="#6E6E73",
        bbox=dict(fc="white", ec="none", pad=1))
ax.text(start, bottom, f"prediction {start:.0f}%", ha="center", va="top", fontsize=9,
        color="#1d1d1f", fontweight="semibold", bbox=dict(fc="white", ec="none", pad=1))
ax.set_yticks(range(len(labels)), labels)
ax.set_ylim(len(labels) + 0.2, -0.6)
lo_x = min(base, *(base + np.cumsum(values)))
ax.set_xlim(lo_x - 8, max(base, *(base + np.cumsum(values))) + 8)
ax.set_xlabel("Predicted % of students above the national median in maths")
ax.grid(axis="x"); ax.grid(axis="y", visible=False)
ax.set_title(f"Why this district's predicted maths results are {base - start:.0f} points below average", pad=26)
ax.text(0, 1.02, f"District #{p} · gradient boosting · SHAP values sum exactly from base value to prediction "
        f"(observed: {y.iloc[p]:.0f}%)", transform=ax.transAxes, fontsize=9.5, color="#6E6E73")
plt.show()
Figures use the optional PyStatlas style: add plt.style.use("pystatlas.mplstyle") to match the look exactly.
Data source
- California STAR test results, 1998 (303 school districts). Gill, J. (2001). Generalized Linear Models: A Unified Approach (Quantitative Applications in the Social Sciences, No. 134). Sage. https://www.statsmodels.org/stable/datasets/generated/star98.html
Original data from the California Department of Education's Standardized Testing and Reporting (STAR) program, 1998. Subset distributed with statsmodels (sm.datasets.star98) with the author's permission.
The examples illustrate statistical methods. Their titles describe what each figure shows in these particular data — often a small, dated or partial sample — not the author's position on the substantive question. For interpretation, context and data quality, rely on the original sources cited here.
How to cite
PyStatlas is created and maintained by Thierry Warin. If it helped your work, please cite it.
Warin, T. (2026). SHAP waterfall for one prediction. In PyStatlas: A Python Gallery of Statistical Graphics for the Social Sciences. https://warint.github.io/pystatlas/machine-learning/shap-waterfall/
@misc{warin2026statlas,
  author       = {Warin, Thierry},
  title        = {PyStatlas: A Python Gallery of Statistical Graphics for the Social Sciences},
  year         = {2026},
  howpublished = {\url{https://warint.github.io/pystatlas/}},
  note         = {Source code: https://github.com/warint/pystatlas}
}More in Machine learning
Confusion matrix with metrics
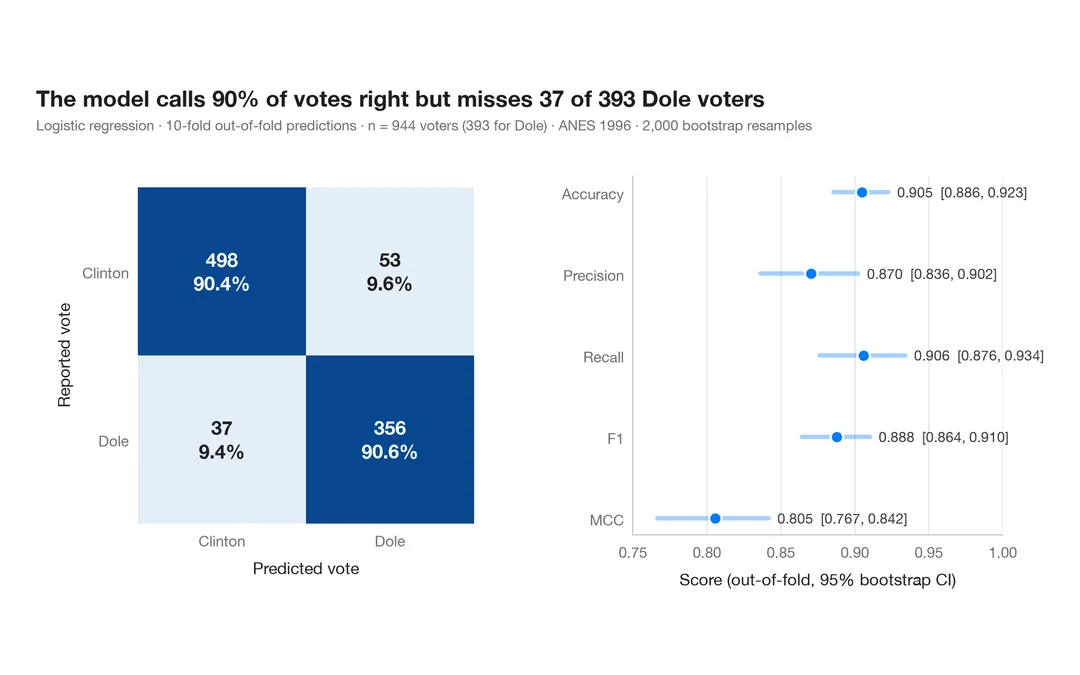
How well a logistic regression predicts who voted Dole in 1996 — out-of-fold confusion matrix with counts and row shares, and bootstrap intervals for the headline metrics.
yardstick::conf_mat() + autoplot()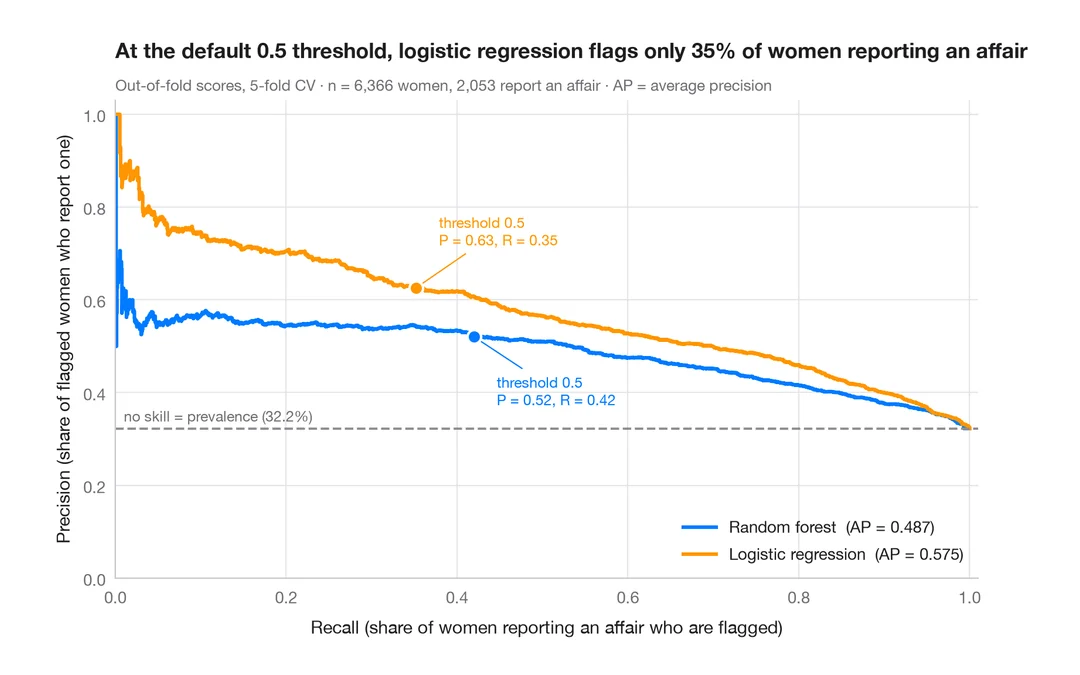
Precision–recall curves
Out-of-fold precision–recall curves for two classifiers predicting which married women report an affair, with average precision and the no-skill baseline.
yardstick::pr_curve() + autoplot()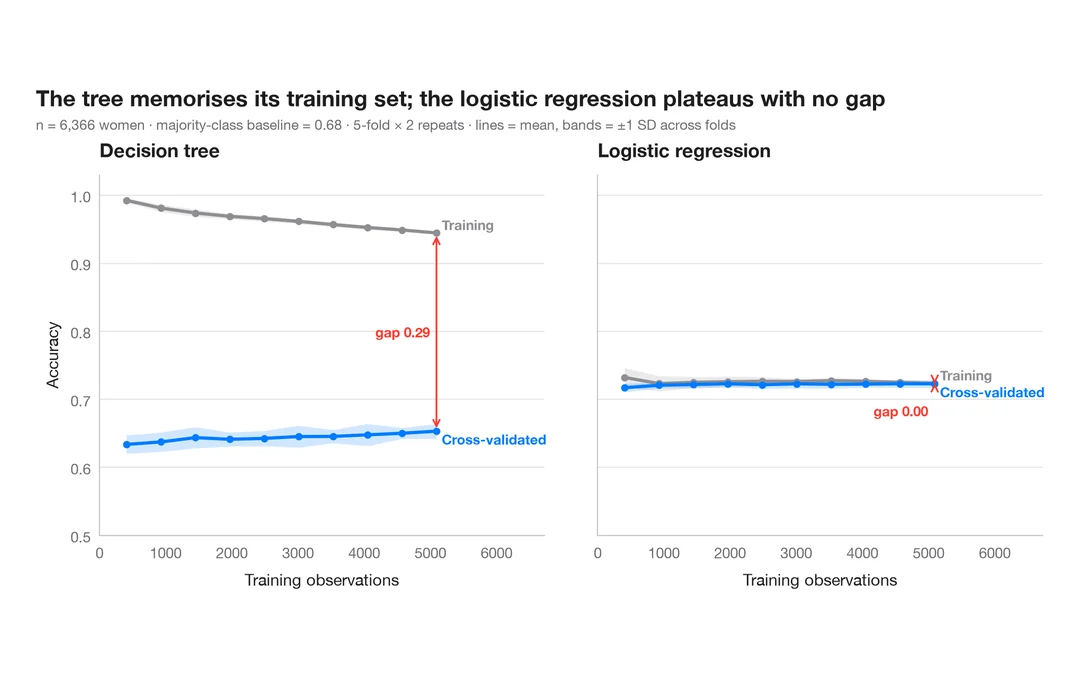
Learning curve
Training and cross-validated accuracy as the training set grows, for two models predicting which married women report an affair.
caret::learning_curve_dat() + ggplot()