Confusion matrix with metrics
How well a logistic regression predicts who voted Dole in 1996 — out-of-fold confusion matrix with counts and row shares, and bootstrap intervals for the headline metrics.
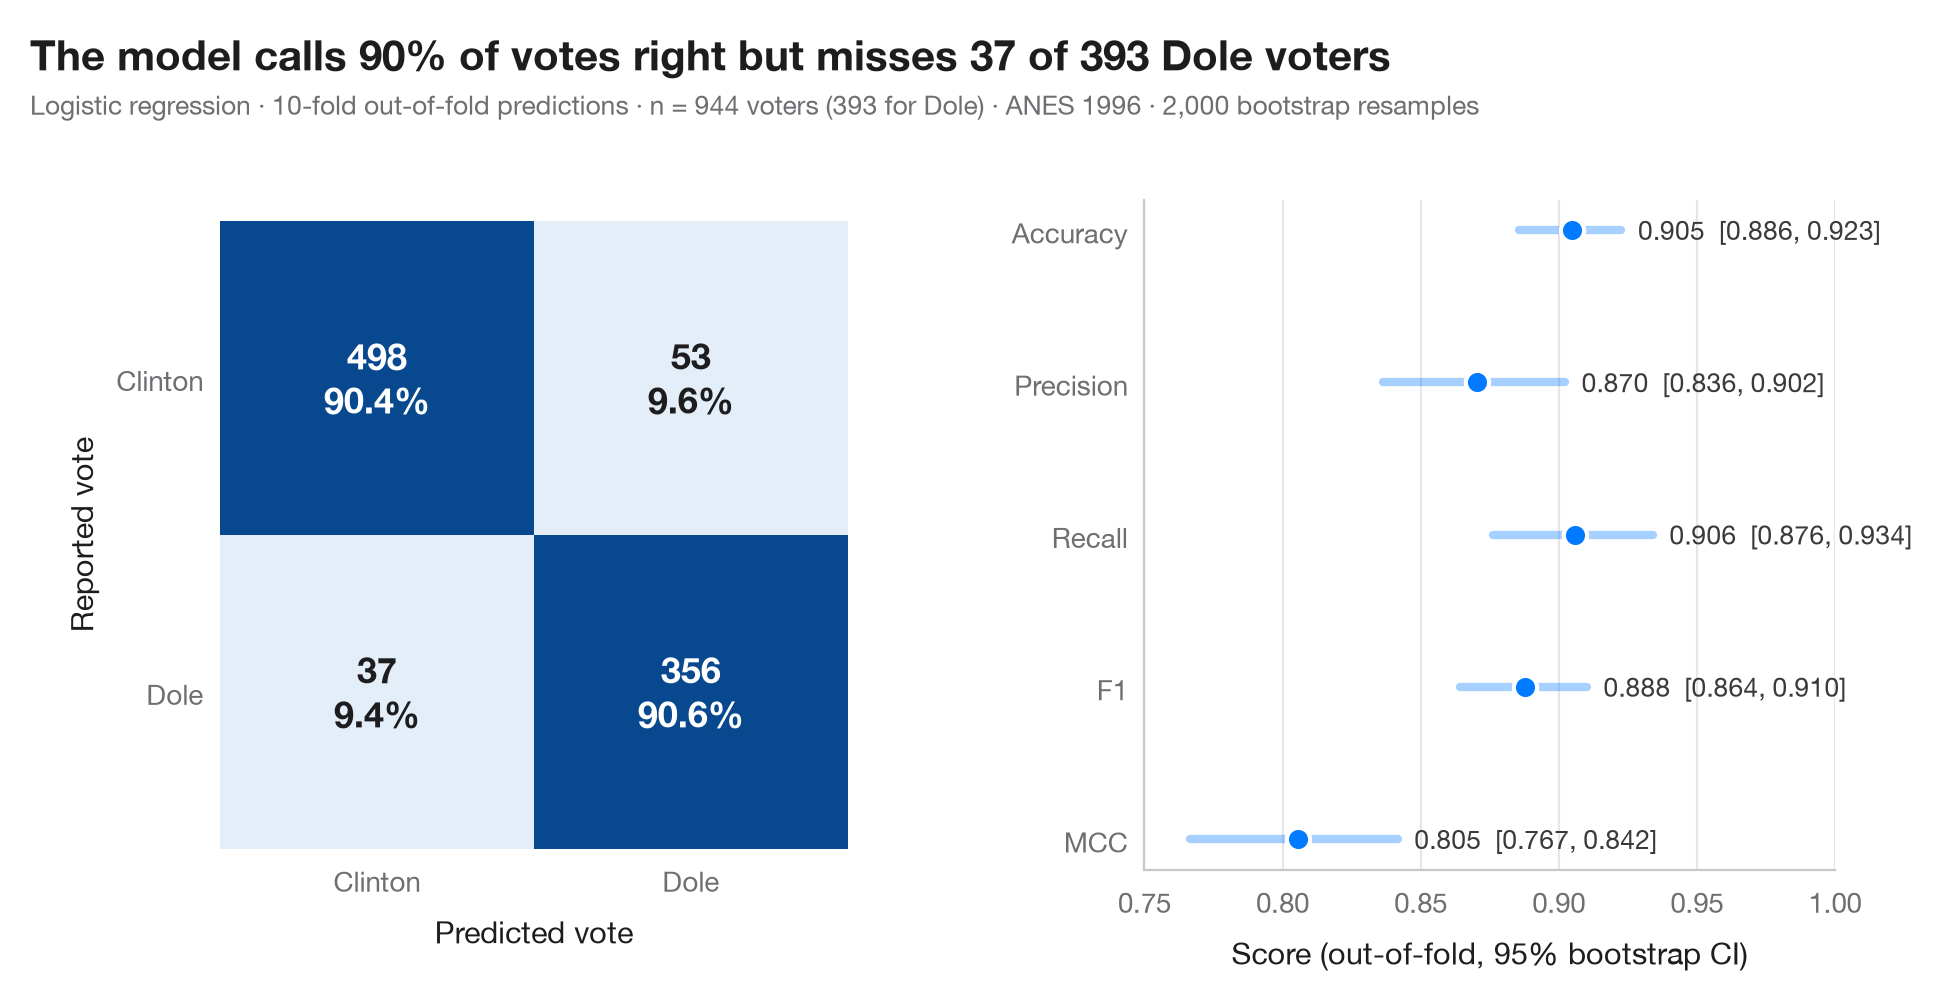
A confusion matrix crosses the true class with the predicted class. Each cell shows a count and its share of the true class (the row), so the diagonal reads directly as sensitivity and specificity. The predictions are out-of-fold: every observation is predicted by a model that never saw it during a 10-fold cross-validation, which is what the matrix would look like on new data.
The side panel reports accuracy, precision, recall, F1 and the Matthews
correlation coefficient (MCC), each with a 95% bootstrap interval — a single
number hides how much it would move with another sample. Data are the 944
respondents of the 1996 American National Election Study who voted for
Clinton or Dole, bundled with statsmodels (sm.datasets.anes96). The
model predicts a Dole vote from party identification, left–right
self-placement, age, education, income, days watching TV news and the
population of the respondent's place of residence (log). It is a standardised
logistic regression; the predictions come from cross_val_predict and the
metrics from sklearn.metrics.
import matplotlib.pyplot as plt
import numpy as np
import statsmodels.api as sm
from sklearn.linear_model import LogisticRegression
from sklearn.metrics import (accuracy_score, confusion_matrix, f1_score, matthews_corrcoef,
                             precision_score, recall_score)
from sklearn.model_selection import StratifiedKFold, cross_val_predict
from sklearn.pipeline import make_pipeline
from sklearn.preprocessing import StandardScaler

# Data: 944 voters in the 1996 US presidential election; 1 = voted Dole, 0 = voted Clinton
d = sm.datasets.anes96.load_pandas().data
X = d[["PID", "selfLR", "age", "educ", "income", "TVnews", "logpopul"]]
y = d["vote"].to_numpy().astype(int)
labels = ["Clinton", "Dole"]

# Out-of-fold predictions from a 10-fold cross-validation
model = make_pipeline(StandardScaler(), LogisticRegression(max_iter=1000))
cv = StratifiedKFold(n_splits=10, shuffle=True, random_state=0)
pred = cross_val_predict(model, X, y, cv=cv)
cm = confusion_matrix(y, pred)

# Metrics with 95% bootstrap intervals
metrics = {"Accuracy": accuracy_score, "Precision": precision_score, "Recall": recall_score,
           "F1": f1_score, "MCC": matthews_corrcoef}
rng = np.random.default_rng(1)
boot = {k: [] for k in metrics}
for _ in range(2000):
    i = rng.integers(0, len(y), len(y))
    for k, f in metrics.items():
        boot[k].append(f(y[i], pred[i]))
point = {k: f(y, pred) for k, f in metrics.items()}
ci = {k: np.percentile(v, [2.5, 97.5]) for k, v in boot.items()}

plt.rcParams["figure.constrained_layout.use"] = False   # manual margins leave room for the subtitle
fig, (ax, axm) = plt.subplots(1, 2, figsize=(9.5, 5), gridspec_kw=dict(width_ratios=(1, 1.1)))
fig.subplots_adjust(left=0.12, right=0.97, top=0.80, bottom=0.13, wspace=0.45)

# Confusion matrix: colour = share of the true class
share = cm / cm.sum(axis=1, keepdims=True)
ax.imshow(share, cmap="Blues", vmin=0, vmax=1)
for r in range(2):
    for c in range(2):
        ax.text(c, r, f"{cm[r, c]}\n{share[r, c]:.1%}", ha="center", va="center", fontsize=13,
                fontweight="semibold", color="white" if share[r, c] > 0.5 else "#1d1d1f")
ax.set_xticks([0, 1], labels)
ax.set_yticks([0, 1], labels)
ax.set_xlabel("Predicted vote")
ax.set_ylabel("Reported vote")
ax.grid(False)
for s in ax.spines.values():
    s.set_visible(False)

# Metrics with intervals
names = list(metrics)[::-1]
for j, k in enumerate(names):
    axm.plot(ci[k], [j, j], color="#007AFF", lw=3, solid_capstyle="round", alpha=0.35)
    axm.scatter(point[k], j, s=70, color="#007AFF", zorder=3, edgecolor="white", lw=1.5)
    axm.text(ci[k][1] + 0.006, j, f"{point[k]:.3f}  [{ci[k][0]:.3f}, {ci[k][1]:.3f}]",
             va="center", fontsize=9.5, color="#3A3A3C")
axm.set_yticks(range(len(names)), names)
axm.set_xlim(0.75, 1.0)
axm.set_xlabel("Score (out-of-fold, 95% bootstrap CI)")
axm.grid(axis="x"); axm.grid(axis="y", visible=False)

fn, pos = cm[1, 0], cm[1].sum()
fig.suptitle(f"The model calls {point['Accuracy']:.0%} of votes right but misses {fn} of {pos} Dole voters",
             x=0.02, y=0.97, ha="left")
fig.text(0.02, 0.885, f"Logistic regression · 10-fold out-of-fold predictions · n = {len(y)} voters "
         f"({y.sum()} for Dole) · ANES 1996 · 2,000 bootstrap resamples", fontsize=9.5, color="#6E6E73")
plt.show()
Figures use the optional PyStatlas style: add plt.style.use("pystatlas.mplstyle") to match the look exactly.
Data source
- American National Election Study, 1996. Rosenstone, S. J., Kinder, D. R., Miller, W. E., & the National Election Studies. (2016). ANES 1996 Time Series Study (ICPSR 6896; Version 6) [Data set]. Inter-university Consortium for Political and Social Research. https://doi.org/10.3886/ICPSR06896.v6
Subset of 944 respondents distributed with statsmodels (sm.datasets.anes96); public domain.
The examples illustrate statistical methods. Their titles describe what each figure shows in these particular data — often a small, dated or partial sample — not the author's position on the substantive question. For interpretation, context and data quality, rely on the original sources cited here.
How to cite
PyStatlas is created and maintained by Thierry Warin. If it helped your work, please cite it.
Warin, T. (2026). Confusion matrix with metrics. In PyStatlas: A Python Gallery of Statistical Graphics for the Social Sciences. https://warint.github.io/pystatlas/machine-learning/confusion-matrix/
@misc{warin2026statlas,
  author       = {Warin, Thierry},
  title        = {PyStatlas: A Python Gallery of Statistical Graphics for the Social Sciences},
  year         = {2026},
  howpublished = {\url{https://warint.github.io/pystatlas/}},
  note         = {Source code: https://github.com/warint/pystatlas}
}More in Machine learning
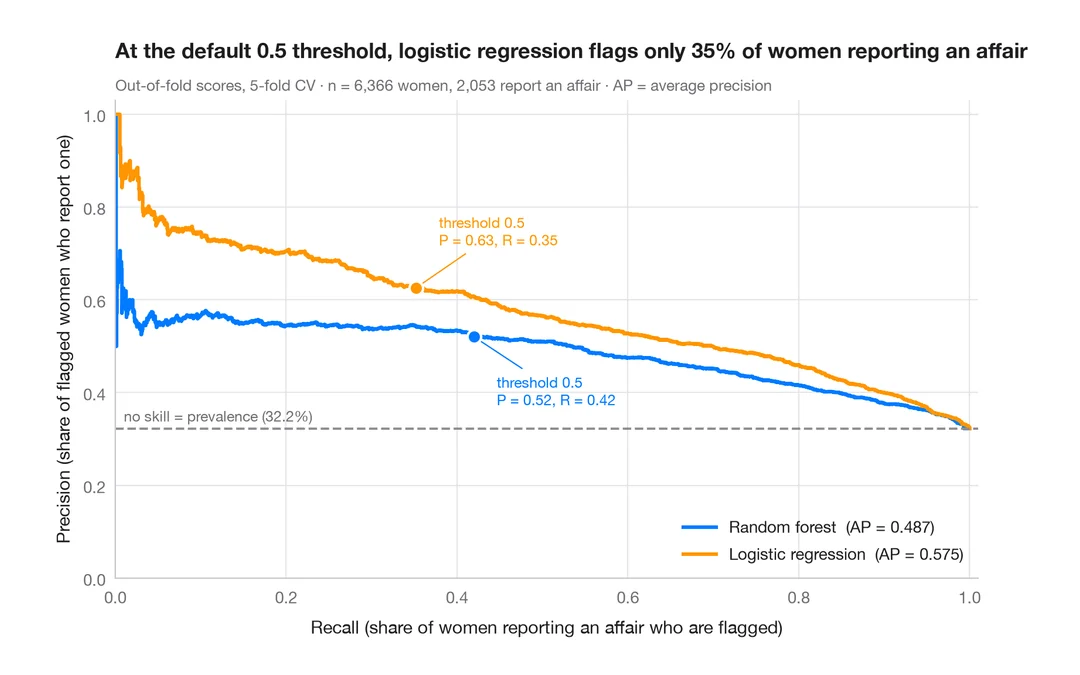
Precision–recall curves
Out-of-fold precision–recall curves for two classifiers predicting which married women report an affair, with average precision and the no-skill baseline.
yardstick::pr_curve() + autoplot()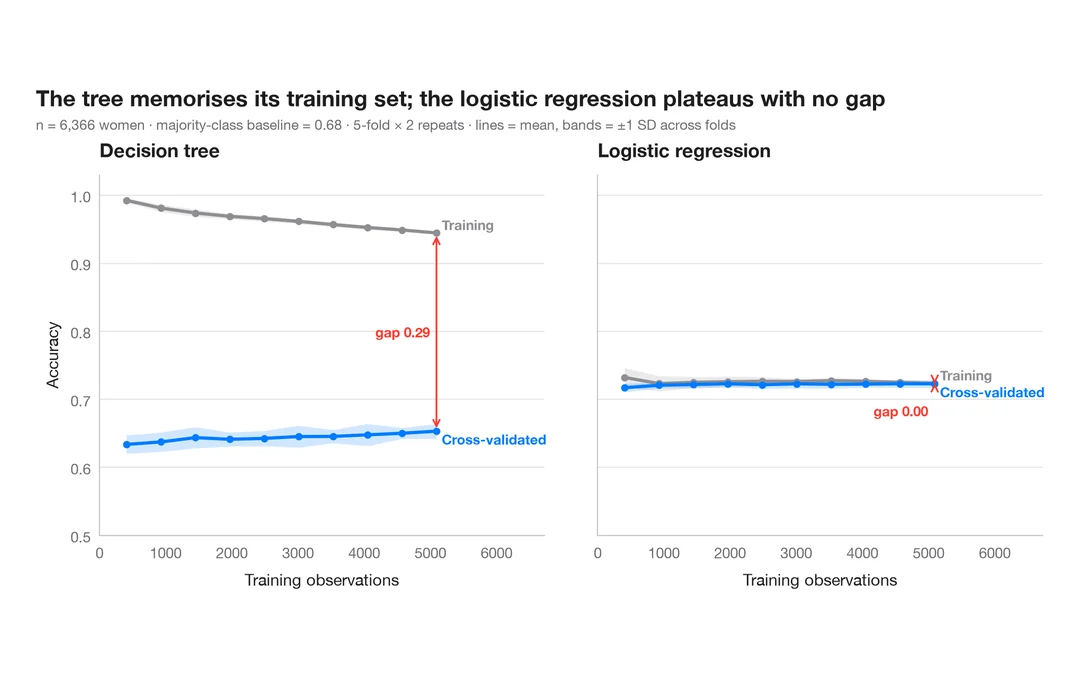
Learning curve
Training and cross-validated accuracy as the training set grows, for two models predicting which married women report an affair.
caret::learning_curve_dat() + ggplot()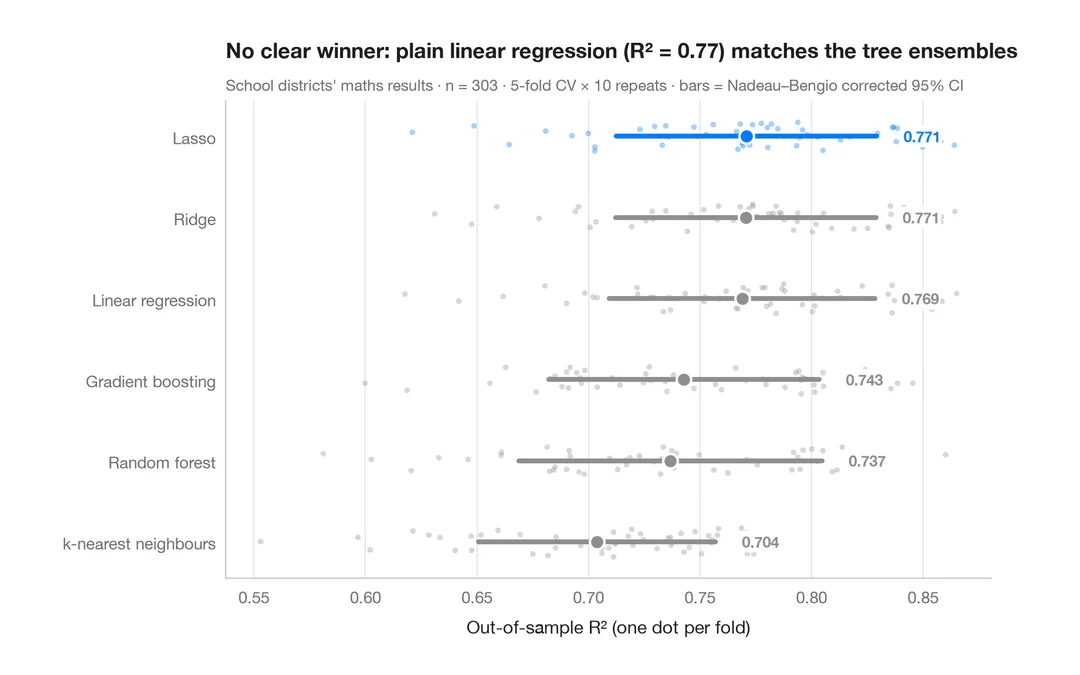
Cross-validated model comparison
Fold-by-fold R² of six models predicting California school districts' maths results, with means and corrected 95% intervals.
caret::resamples() + bwplot() / tune::autoplot()