Precision–recall curves
Out-of-fold precision–recall curves for two classifiers predicting which married women report an affair, with average precision and the no-skill baseline.
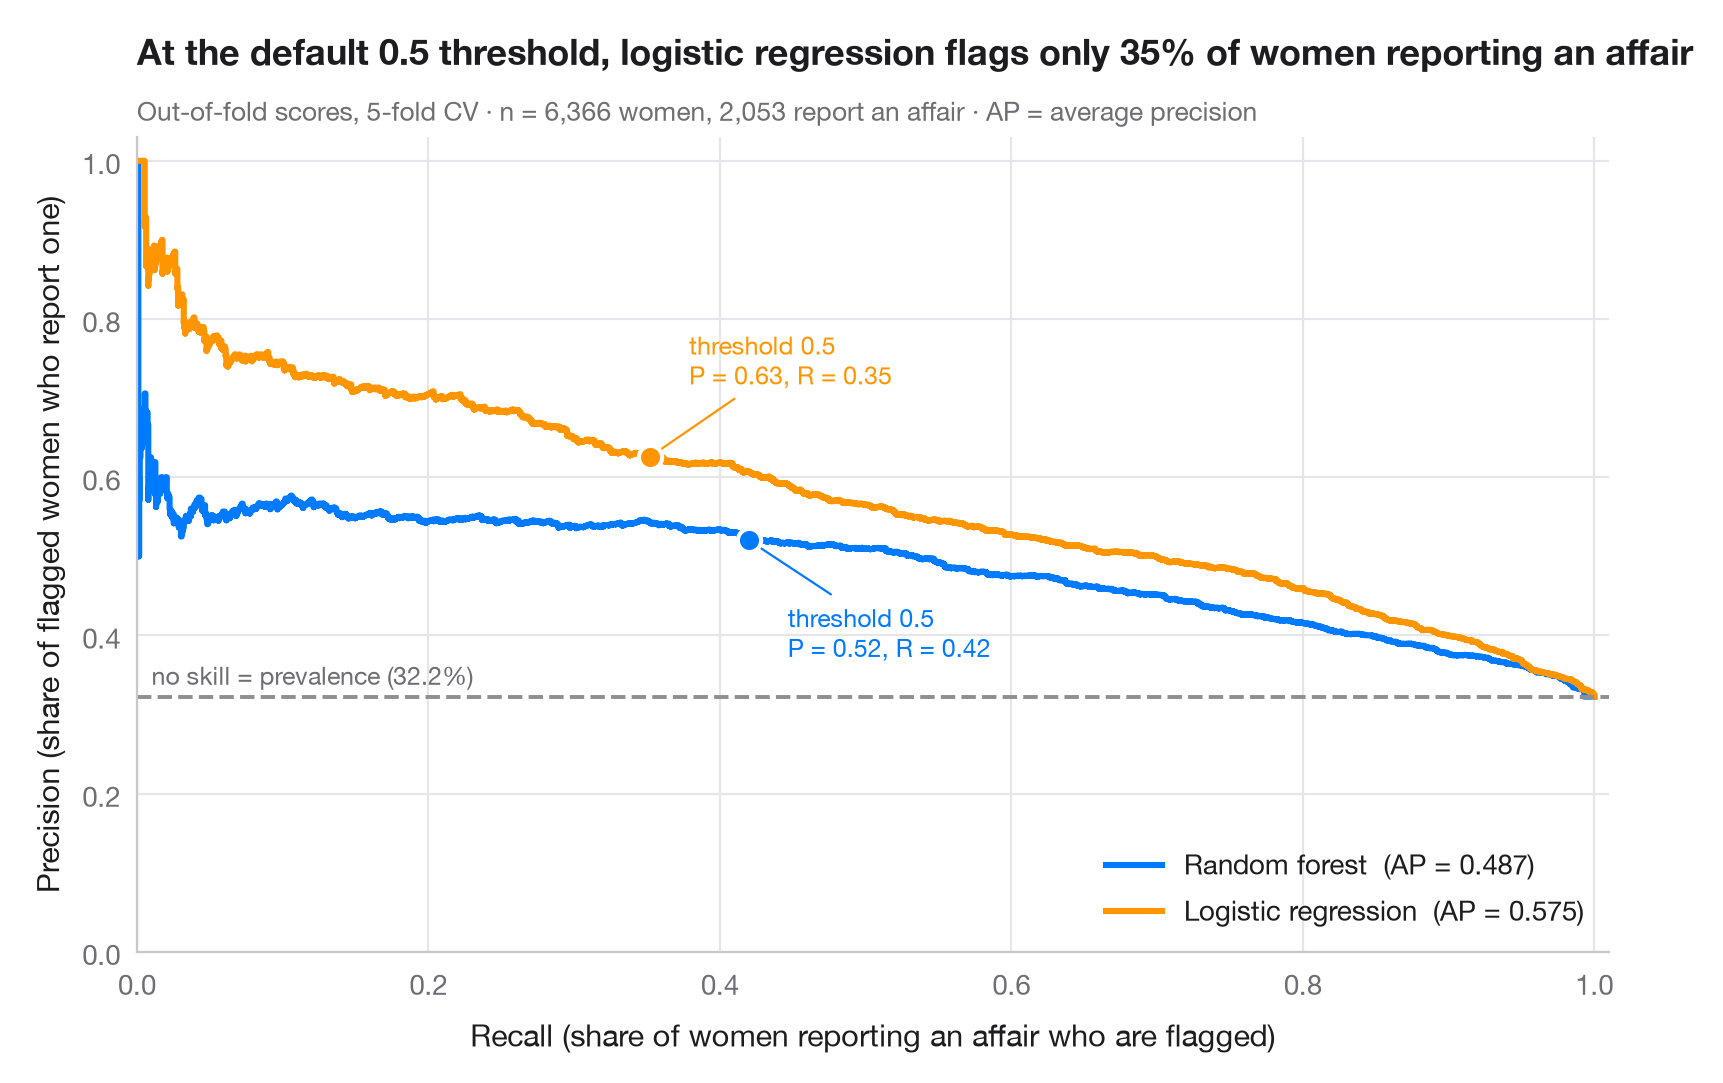
When the positive class is a minority, a ROC curve can look excellent while many alarms are false. The precision–recall curve answers the operational question instead: if I want to catch this share of positives (recall), how many of my alerts will be right (precision)? Each point is one decision threshold. The dashed line is the no-skill baseline — the prevalence of the positive class — and the area under each curve is summarised by the average precision (AP).
Data are the 6,366 married women of the 1974 Redbook magazine survey analysed
by Fair (1978), bundled with statsmodels (sm.datasets.fair). The outcome
is whether a woman reports any extramarital affair — a minority class, about
one in three. The predictors are her rating of the marriage, age, years
married, number of children, religiousness, education and her own and her
husband's occupation. Scores are out-of-fold probabilities from a 5-fold
cross-validation (cross_val_predict(method="predict_proba")); curves and AP
come from precision_recall_curve and average_precision_score. The marker
shows the default 0.5 threshold on each curve. Here the logistic regression
ranks women better than the random forest (higher AP), yet at the 0.5
threshold it flags only about a third of those who report an affair.
import matplotlib.pyplot as plt
import numpy as np
import statsmodels.api as sm
from sklearn.ensemble import RandomForestClassifier
from sklearn.linear_model import LogisticRegression
from sklearn.metrics import average_precision_score, precision_recall_curve
from sklearn.model_selection import StratifiedKFold, cross_val_predict
from sklearn.pipeline import make_pipeline
from sklearn.preprocessing import StandardScaler

# Data: 6,366 married women (1974 survey); 1 = reports any extramarital affair (a minority class)
d = sm.datasets.fair.load_pandas().data
X = d.drop(columns="affairs")
y = (d["affairs"] > 0).astype(int).to_numpy()
prevalence = y.mean()

models = {
    "Random forest": RandomForestClassifier(n_estimators=300, random_state=0),
    "Logistic regression": make_pipeline(StandardScaler(), LogisticRegression(max_iter=2000)),
}
palette = ["#007AFF", "#FF9500"]
cv = StratifiedKFold(n_splits=5, shuffle=True, random_state=0)
recall = {}

fig, ax = plt.subplots(figsize=(8, 5.2))
for (name, model), c in zip(models.items(), palette):
    score = cross_val_predict(model, X, y, cv=cv, method="predict_proba")[:, 1]
    prec, rec, thr = precision_recall_curve(y, score)
    ap = average_precision_score(y, score)
    ax.step(rec, prec, where="post", color=c, lw=2.2, label=f"{name}  (AP = {ap:.3f})")
    k = np.argmin(np.abs(thr - 0.5))  # the default threshold
    recall[name] = rec[k]
    ax.scatter(rec[k], prec[k], s=70, color=c, edgecolor="white", lw=1.5, zorder=4)
    ax.annotate(f"threshold 0.5\nP = {prec[k]:.2f}, R = {rec[k]:.2f}", (rec[k], prec[k]),
                xytext=(14, -42 if c == palette[0] else 26), textcoords="offset points",
                ha="left", fontsize=9, color=c,
                arrowprops=dict(arrowstyle="-", color=c, lw=0.8))

ax.axhline(prevalence, color="#8E8E93", ls="--", lw=1.4)
ax.text(0.01, prevalence + 0.015, f"no skill = prevalence ({prevalence:.1%})", fontsize=9, color="#6E6E73")
ax.set_xlim(0, 1.01)
ax.set_ylim(0, 1.03)
ax.set_xlabel("Recall (share of women reporting an affair who are flagged)")
ax.set_ylabel("Precision (share of flagged women who report one)")
ax.grid(axis="x")
ax.legend(loc="lower right")
ax.set_title(f"At the default 0.5 threshold, logistic regression flags only {recall['Logistic regression']:.0%} "
             "of women reporting an affair", pad=26)
ax.text(0, 1.02, f"Out-of-fold scores, 5-fold CV · n = {len(y):,} women, {y.sum():,} report an affair · "
        "AP = average precision", transform=ax.transAxes, fontsize=9.5, color="#6E6E73")
plt.show()
Figures use the optional PyStatlas style: add plt.style.use("pystatlas.mplstyle") to match the look exactly.
Data source
- Redbook survey of married women, 1974 (Fair's affairs data). Fair, R. C. (1978). A theory of extramarital affairs. Journal of Political Economy, 86(1), 45–61. https://doi.org/10.1086/260646
Data from the 1974 Redbook magazine survey; distributed with statsmodels (sm.datasets.fair) with the author's permission.
The examples illustrate statistical methods. Their titles describe what each figure shows in these particular data — often a small, dated or partial sample — not the author's position on the substantive question. For interpretation, context and data quality, rely on the original sources cited here.
How to cite
PyStatlas is created and maintained by Thierry Warin. If it helped your work, please cite it.
Warin, T. (2026). Precision–recall curves. In PyStatlas: A Python Gallery of Statistical Graphics for the Social Sciences. https://warint.github.io/pystatlas/machine-learning/precision-recall/
@misc{warin2026statlas,
  author       = {Warin, Thierry},
  title        = {PyStatlas: A Python Gallery of Statistical Graphics for the Social Sciences},
  year         = {2026},
  howpublished = {\url{https://warint.github.io/pystatlas/}},
  note         = {Source code: https://github.com/warint/pystatlas}
}More in Machine learning
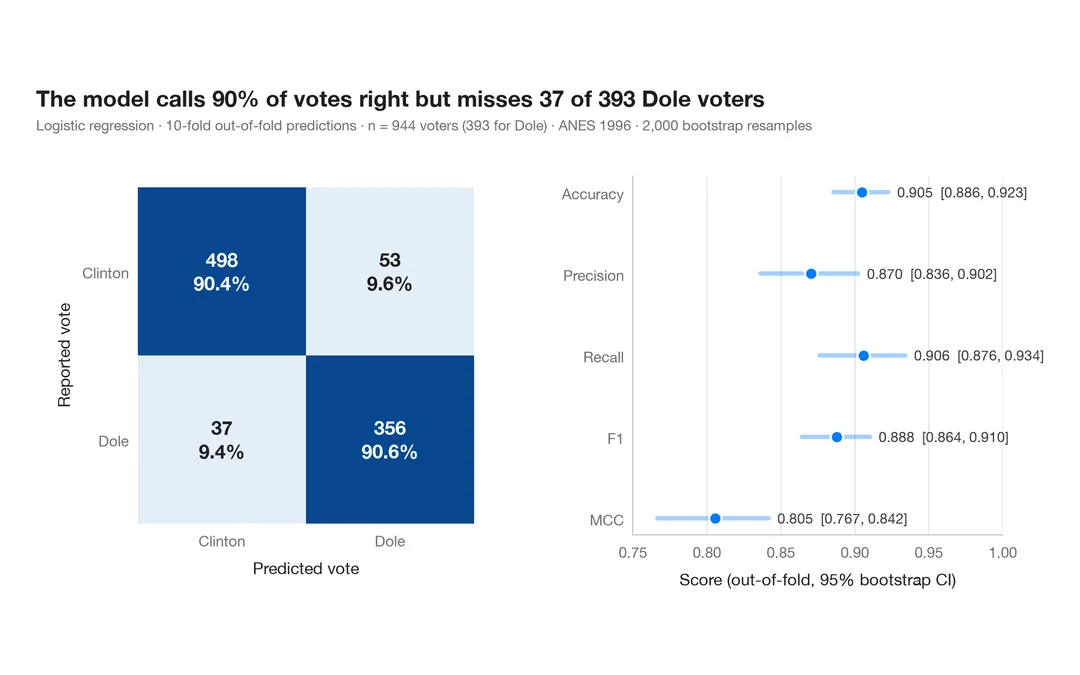
Confusion matrix with metrics
How well a logistic regression predicts who voted Dole in 1996 — out-of-fold confusion matrix with counts and row shares, and bootstrap intervals for the headline metrics.
yardstick::conf_mat() + autoplot()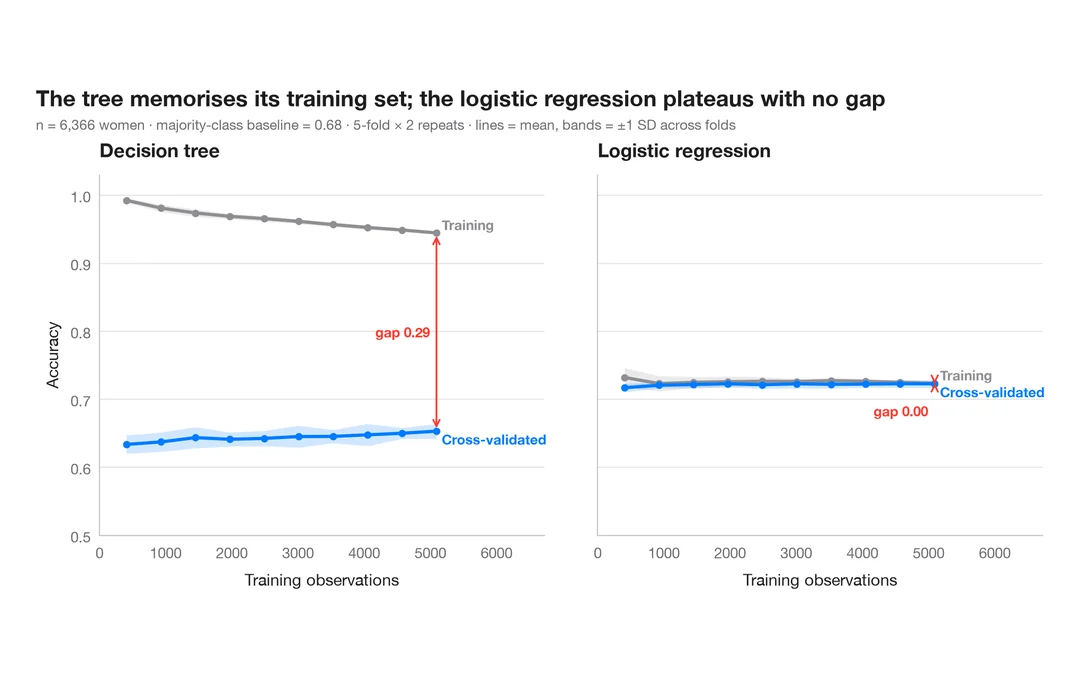
Learning curve
Training and cross-validated accuracy as the training set grows, for two models predicting which married women report an affair.
caret::learning_curve_dat() + ggplot()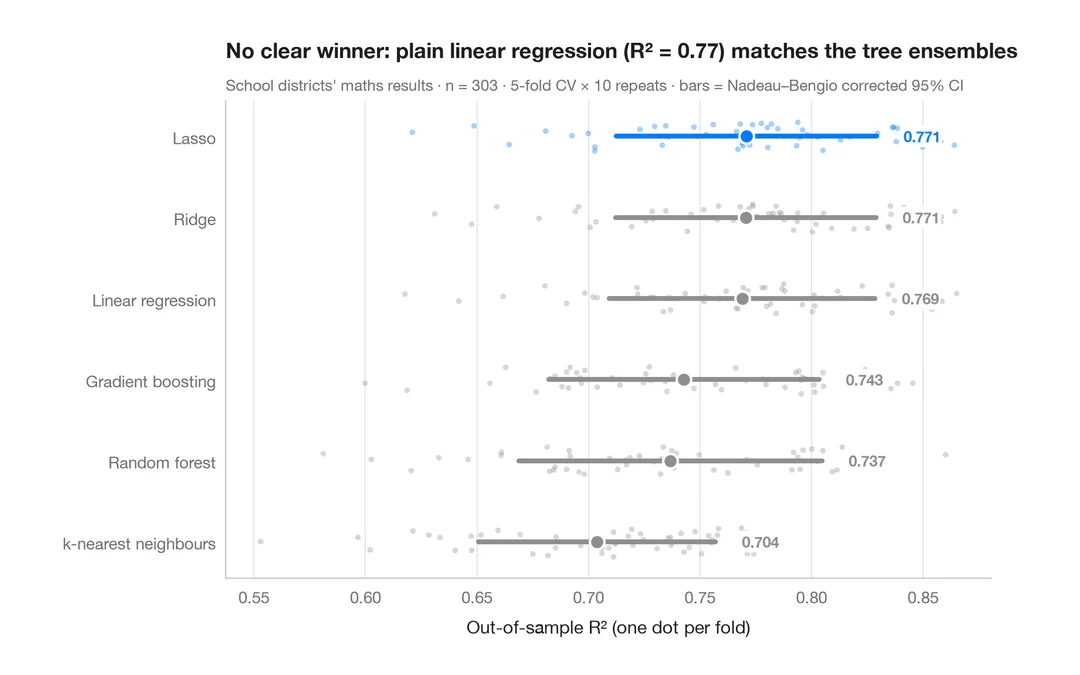
Cross-validated model comparison
Fold-by-fold R² of six models predicting California school districts' maths results, with means and corrected 95% intervals.
caret::resamples() + bwplot() / tune::autoplot()