影響度プロット
スチューデント化残差対てこ比を、クックの距離に応じた大きさのバブルで描きます。
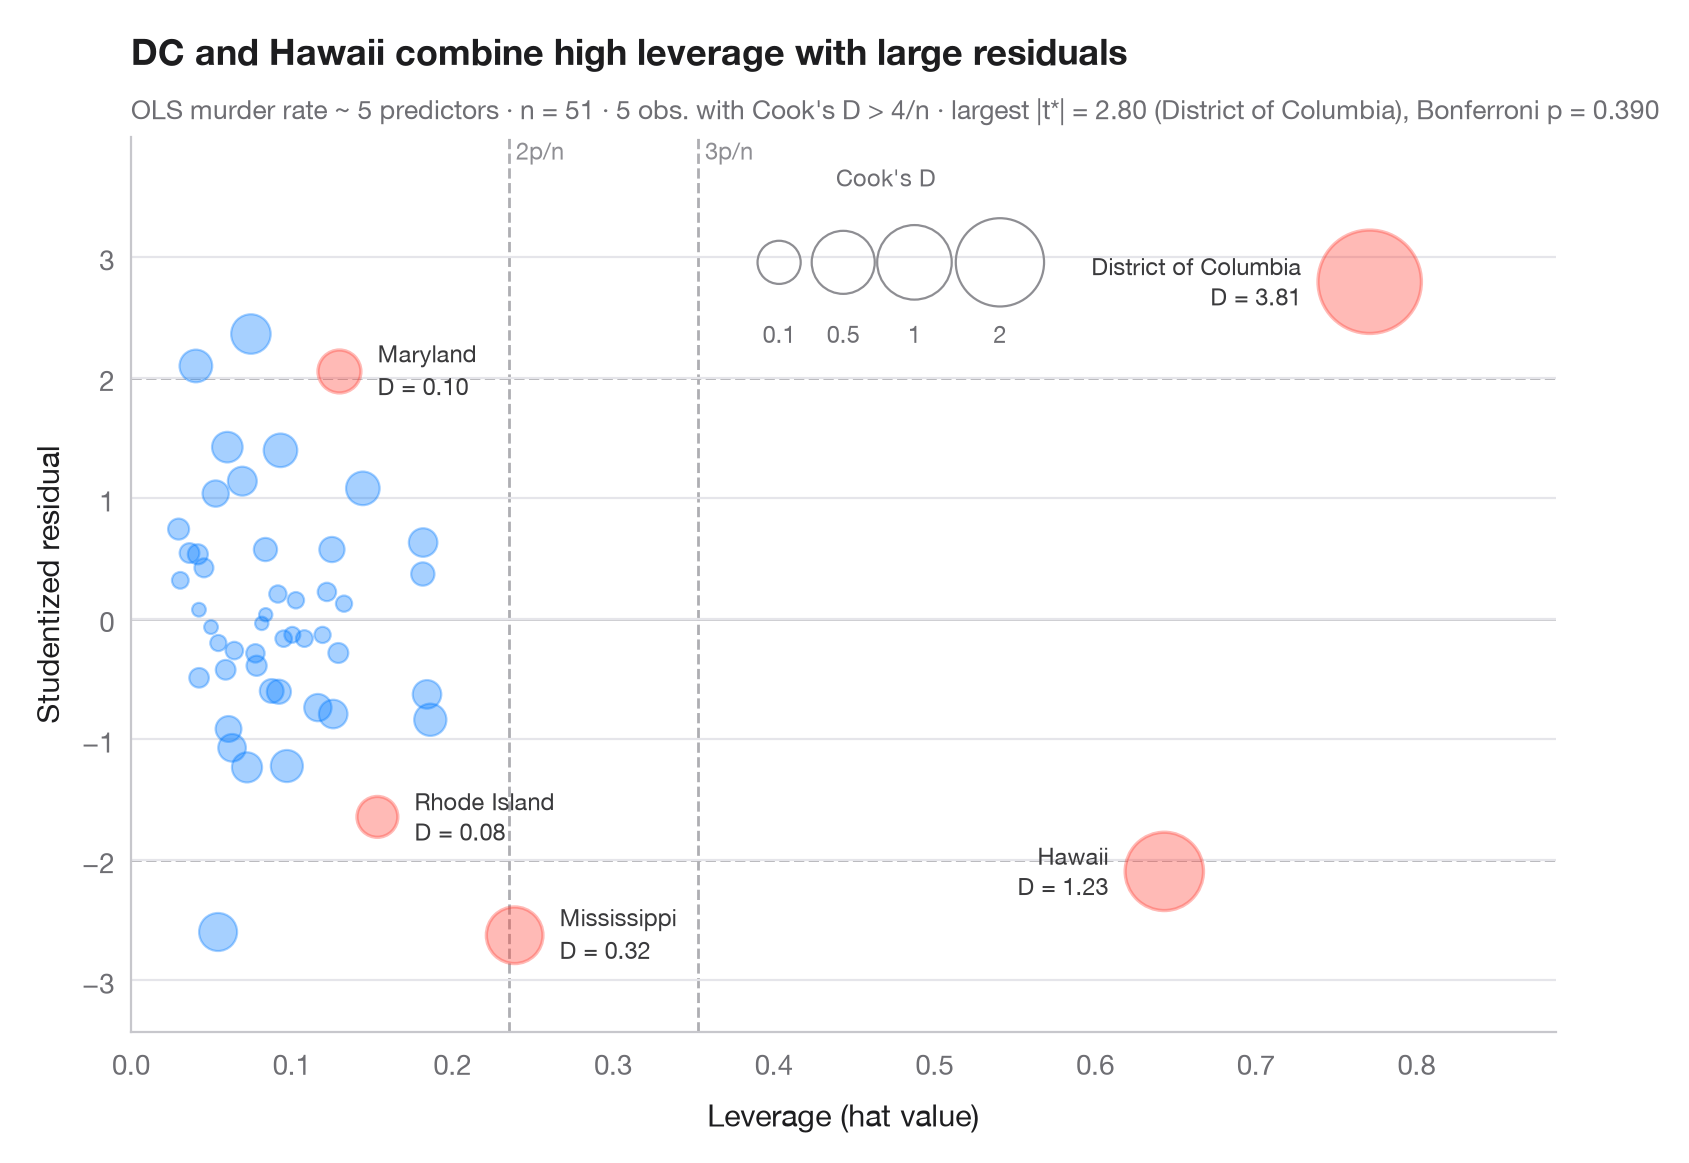
観測値は、説明変数の値が特異であり(てこ比が高い、x軸)、かつ当てはまりが悪い(スチューデント化残差が大きい、y軸)とき、影響力が大きい といえます。バブルの面積は両者を組み合わせたクックの距離とともに大きくなります(極端な値でも読みやすいよう √D に比例)。破線は一般的な目安であるてこ比 2p/n と 3p/n、スチューデント化残差 ±2 を示し、クックの D が 4/n を超える観測値には名前と色を付けています。
モデルは statsmodels の OLS で、米国50州+DC の殺人発生率(sm.datasets.statecrime)を説明しています。スチューデント化(削除)残差、ハット値、クックの距離はすべて model.get_influence() から求めています。サブタイトルでは、car::outlierTest() と同様に、最大の残差をボンフェローニの外れ値検定で確認しています。
コードおよび図中のテキストは英語です。
import matplotlib.pyplot as plt
import numpy as np
import statsmodels.api as sm
import statsmodels.formula.api as smf
from scipy import stats

df = sm.datasets.statecrime.load_pandas().data
model = smf.ols("murder ~ poverty + single + urban + hs_grad + white", data=df).fit()
infl = model.get_influence()
rstud, lev, cook = infl.resid_studentized_external, infl.hat_matrix_diag, infl.cooks_distance[0]
n, p = int(model.nobs), int(model.df_model + 1)
flag = cook > 4 / n

fig, ax = plt.subplots(figsize=(8.5, 5.6))

# Rule-of-thumb thresholds
for h in (2 * p / n, 3 * p / n):
    ax.axvline(h, color="#AEAEB2", lw=1, ls="--", zorder=0)
    ax.text(h, 1.0, f" {round(h * n / p)}p/n", transform=ax.get_xaxis_transform(),
            fontsize=8.5, color="#8E8E93", va="top")
for r in (-2, 0, 2):
    ax.axhline(r, color="#AEAEB2" if r else "#C7C7CC", lw=1, ls="--" if r else "-", zorder=0)

# Bubbles: area proportional to √Cook's D (keeps extreme points readable)
area = lambda d: 20 + 700 * np.sqrt(d)
size = area(cook)
ax.scatter(lev[~flag], rstud[~flag], s=size[~flag], color="#007AFF", alpha=0.35,
           edgecolor="#007AFF", lw=0.8)
ax.scatter(lev[flag], rstud[flag], s=size[flag], color="#FF3B30", alpha=0.35,
           edgecolor="#FF3B30", lw=1.2)
for i in np.flatnonzero(flag):
    right = lev[i] > 0.5                          # far-right points: label on the left
    ax.annotate(f"{df.index[i]}\nD = {cook[i]:.2f}", (lev[i], rstud[i]),
                xytext=((-1 if right else 1) * (np.sqrt(size[i]) / 2 + 6), 0),
                textcoords="offset points", ha="right" if right else "left", va="center",
                fontsize=8.5, color="#3A3A3C", linespacing=1.1)

# Bubble-size key
for d, x in zip((0.1, 0.5, 1, 2), (0.455, 0.50, 0.55, 0.61)):
    ax.scatter(x, 0.86, s=area(d), transform=ax.transAxes, color="none",
               edgecolor="#8E8E93", lw=0.8)
    ax.text(x, 0.77, f"{d:g}", transform=ax.transAxes, ha="center", fontsize=8.5, color="#6E6E73")
ax.text(0.53, 0.97, "Cook's D", transform=ax.transAxes, ha="center", va="top",
        fontsize=8.5, color="#6E6E73")

ax.set_ylim(rstud.min() - 0.8, rstud.max() + 1.2)
ax.set_xlim(0, lev.max() * 1.15)
ax.set_xlabel("Leverage (hat value)")
ax.set_ylabel("Studentized residual")
ax.set_title("DC and Hawaii combine high leverage with large residuals", pad=26)

# Bonferroni outlier test on the largest |studentized residual|
k = np.argmax(np.abs(rstud))
p_bonf = min(1, n * 2 * stats.t.sf(abs(rstud[k]), model.df_resid - 1))
ax.text(0, 1.02, f"OLS murder rate ~ 5 predictors · n = {n} · {flag.sum()} obs. with Cook's D > 4/n · "
        f"largest |t*| = {abs(rstud[k]):.2f} ({df.index[k]}), Bonferroni p = {p_bonf:.3f}",
        transform=ax.transAxes, fontsize=9.5, color="#6E6E73")
plt.show()
図にはオプションの PyStatlas スタイル を使用しています。同じ見た目にするには plt.style.use("pystatlas.mplstyle") を追加してください。
データの出典
- US state crime and social indicators, 2009. U.S. Census Bureau. Statistical Abstract of the United States, state tables for 2009 (crime rates from the FBI Uniform Crime Reporting program). https://www.statsmodels.org/stable/datasets/generated/statecrime.html
Compiled for statsmodels (sm.datasets.statecrime); public domain. See the statsmodels page for each variable's table and footnotes.
これらの例は統計手法を説明するためのものです。図のタイトルは、この特定のデータ(多くは小規模で、古く、部分的な標本)で図が示す内容を述べたものであり、実質的な問いに対する著者の立場ではありません。解釈、背景、データの質については、ここに挙げた元の出典を参照してください。
引用方法
PyStatlas は Thierry Warin が作成・運営しています。研究や業務に役立った場合は、ぜひ引用してください。
Warin, T. (2026). Influence plot. In PyStatlas: A Python Gallery of Statistical Graphics for the Social Sciences. https://warint.github.io/pystatlas/model-diagnostics/influence-plot/
@misc{warin2026statlas,
  author       = {Warin, Thierry},
  title        = {PyStatlas: A Python Gallery of Statistical Graphics for the Social Sciences},
  year         = {2026},
  howpublished = {\url{https://warint.github.io/pystatlas/}},
  note         = {Source code: https://github.com/warint/pystatlas}
}モデル診断のその他のグラフ
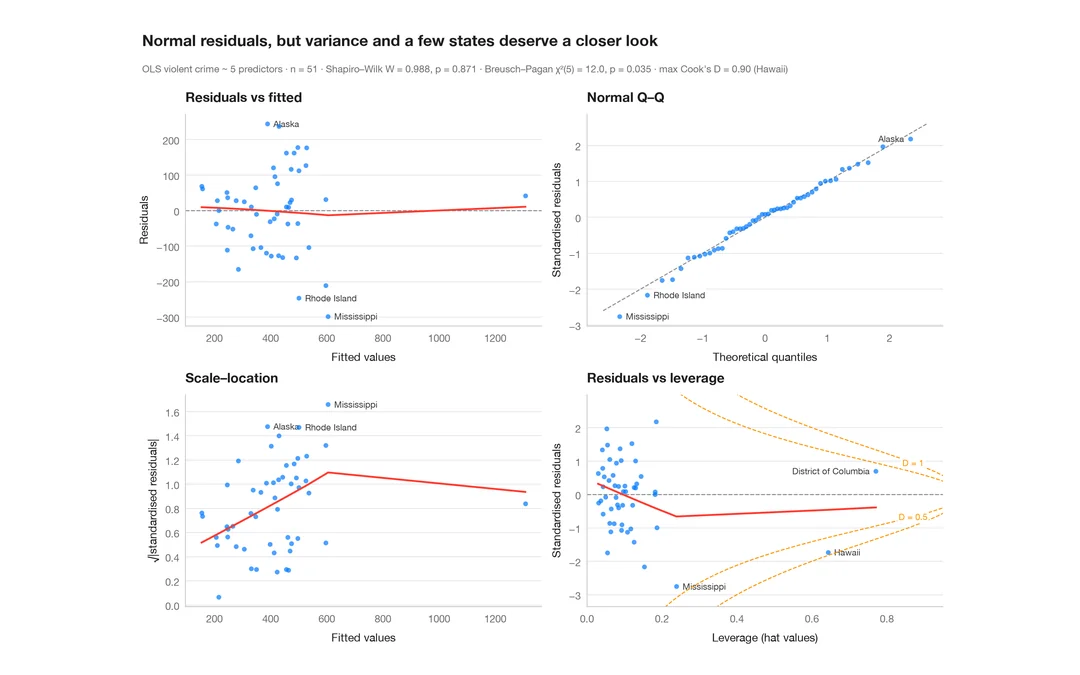
残差診断
線形モデルのための定番の 2 × 2 パネル。線形性、正規性、分散、てこ比を確認します。
plot(lm) / performance::check_model()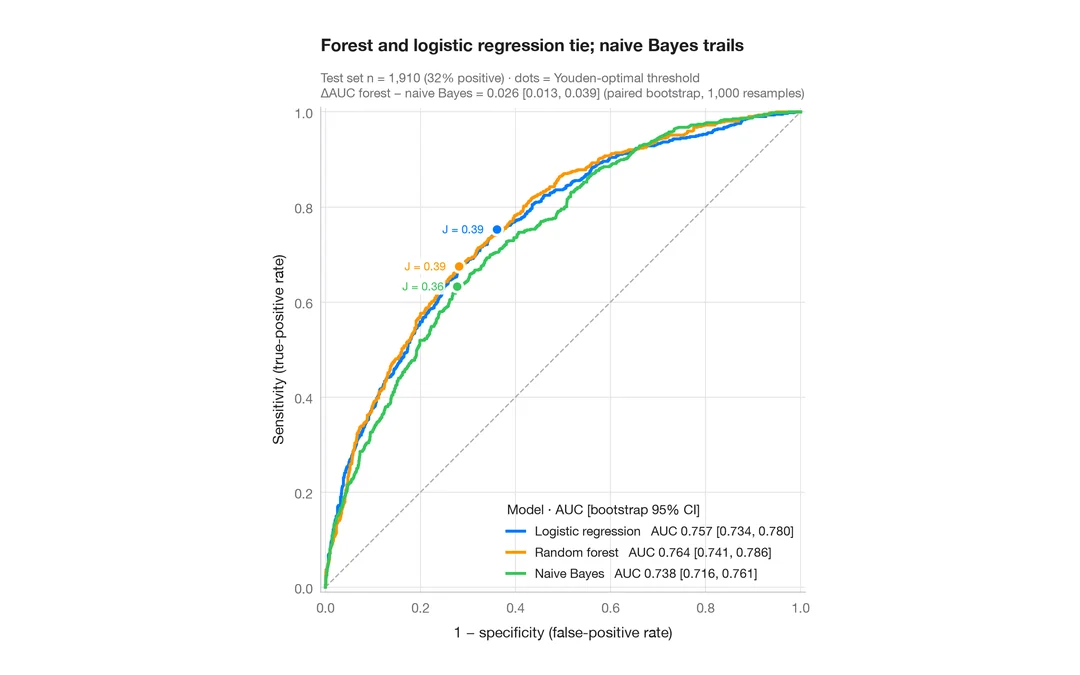
ROC 曲線
3つの分類器を ROC 曲線、ブートストラップ 95% 信頼区間付きの AUC、ユーデン点で比較します。
pROC::ggroc() / pROC::ci.auc()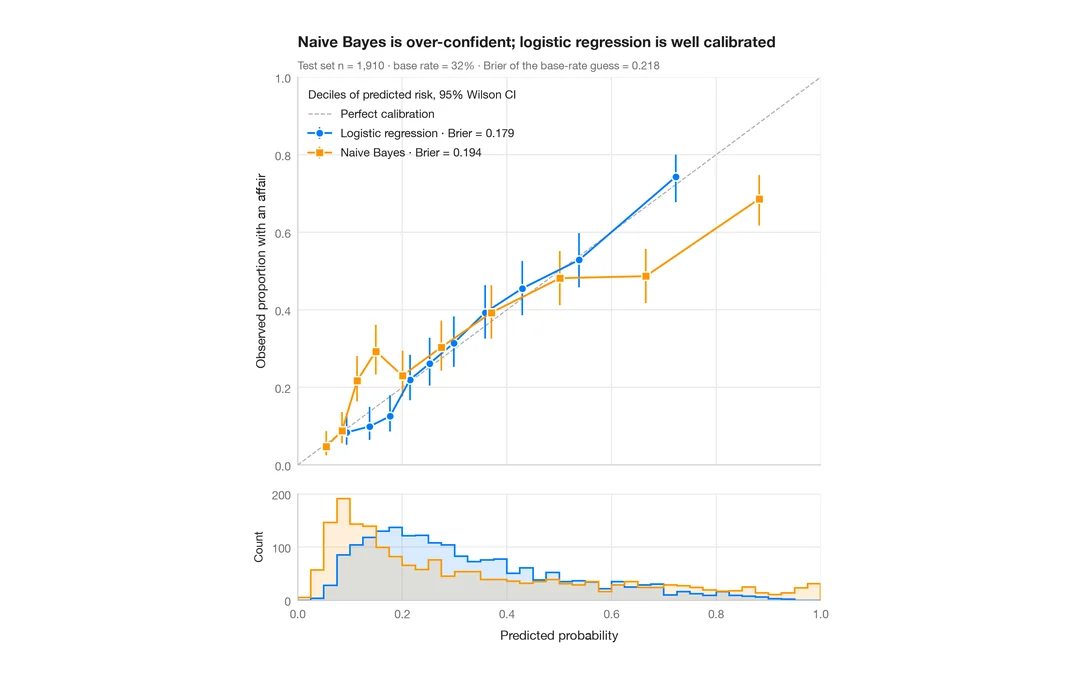
キャリブレーションプロット
十分位ごとの予測リスク対観測リスクを、ウィルソン信頼区間、予測値のヒストグラム、ブライアスコアとともに示します。
rms::calibrate() / probably::cal_plot_breaks()