Influence plot
Studentized residuals vs leverage, with bubbles sized by Cook's distance.
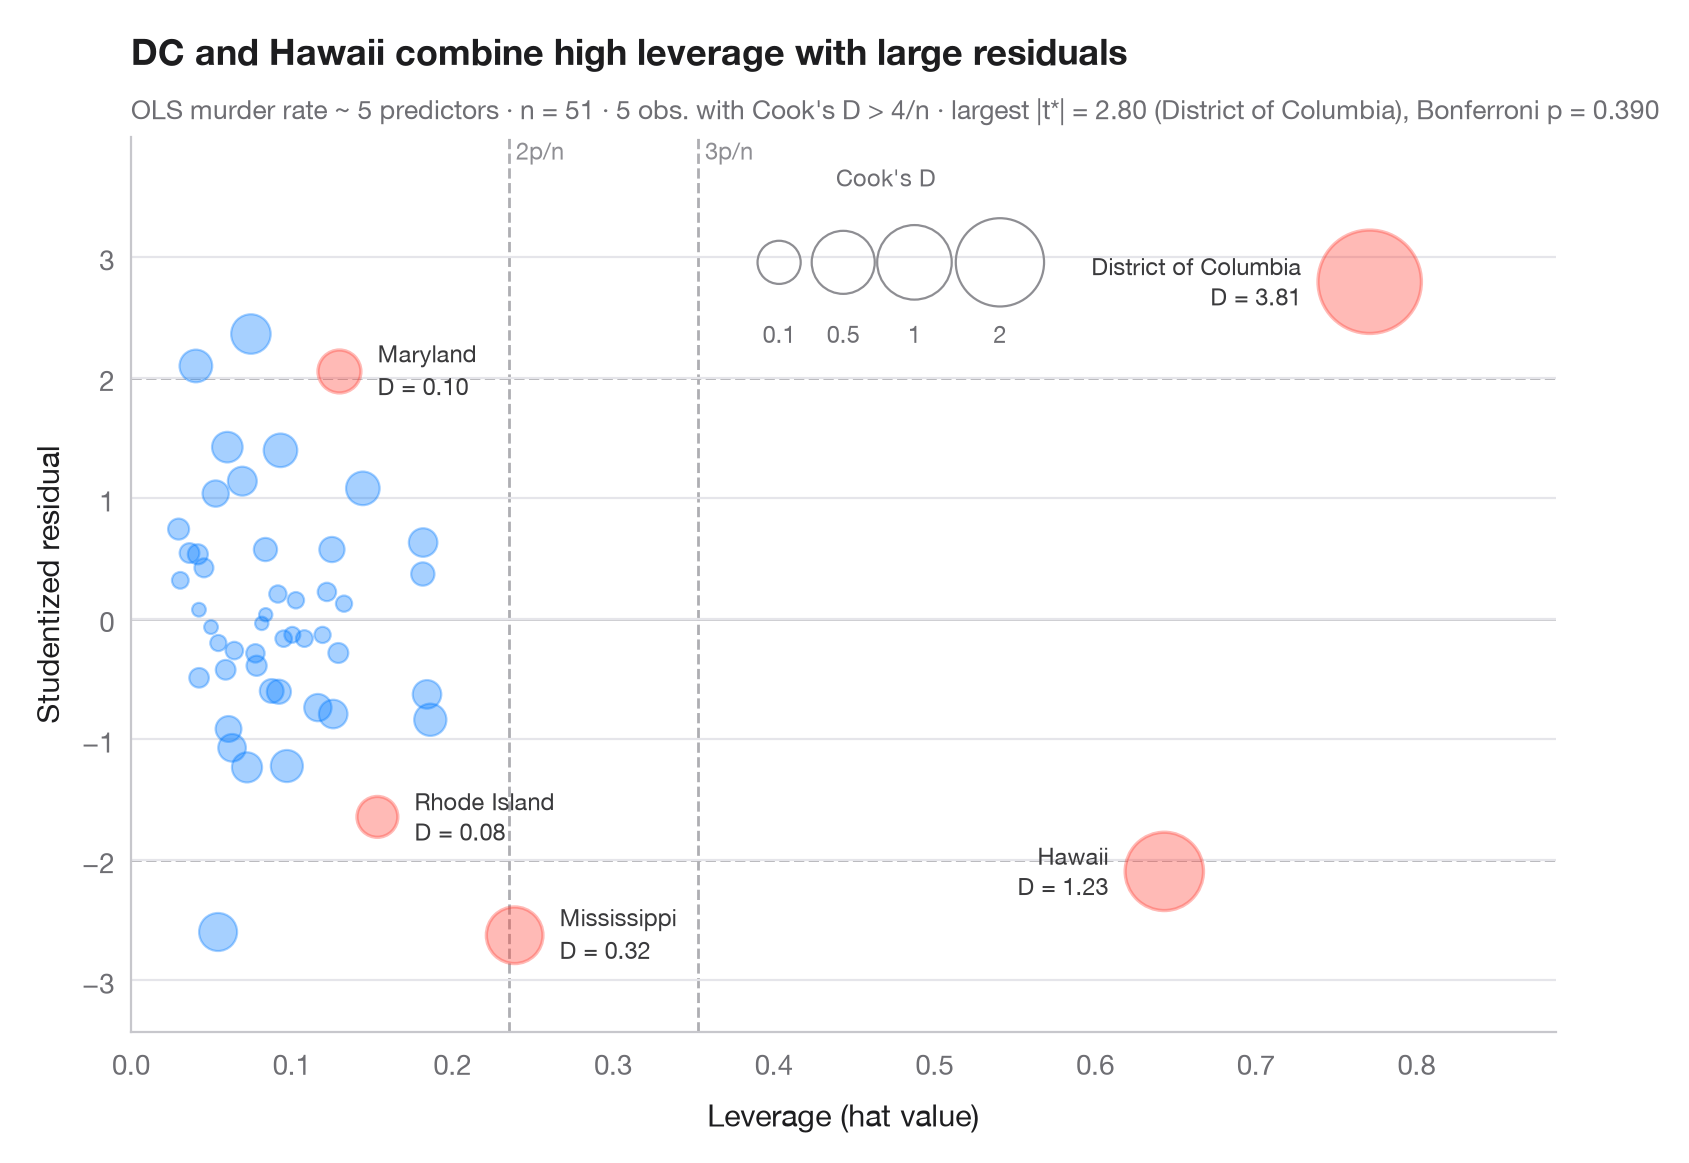
An observation is influential when it is both unusual in its predictors (high leverage, x-axis) and badly fitted (large studentized residual, y-axis). Bubble area grows with Cook's distance (∝ √D, so extremes stay readable), which combines the two. Dashed lines mark the usual rules of thumb — leverage of 2p/n and 3p/n, studentized residuals of ±2 — and observations with Cook's D above 4/n are named and coloured.
The model explains the murder rate of the 50 US states + DC
(sm.datasets.statecrime) with statsmodels OLS. Studentized (deleted)
residuals, hat values and Cook's distances all come from
model.get_influence(); the subtitle checks the largest residual with a
Bonferroni outlier test, as car::outlierTest() does.
import matplotlib.pyplot as plt
import numpy as np
import statsmodels.api as sm
import statsmodels.formula.api as smf
from scipy import stats

df = sm.datasets.statecrime.load_pandas().data
model = smf.ols("murder ~ poverty + single + urban + hs_grad + white", data=df).fit()
infl = model.get_influence()
rstud, lev, cook = infl.resid_studentized_external, infl.hat_matrix_diag, infl.cooks_distance[0]
n, p = int(model.nobs), int(model.df_model + 1)
flag = cook > 4 / n

fig, ax = plt.subplots(figsize=(8.5, 5.6))

# Rule-of-thumb thresholds
for h in (2 * p / n, 3 * p / n):
    ax.axvline(h, color="#AEAEB2", lw=1, ls="--", zorder=0)
    ax.text(h, 1.0, f" {round(h * n / p)}p/n", transform=ax.get_xaxis_transform(),
            fontsize=8.5, color="#8E8E93", va="top")
for r in (-2, 0, 2):
    ax.axhline(r, color="#AEAEB2" if r else "#C7C7CC", lw=1, ls="--" if r else "-", zorder=0)

# Bubbles: area proportional to √Cook's D (keeps extreme points readable)
area = lambda d: 20 + 700 * np.sqrt(d)
size = area(cook)
ax.scatter(lev[~flag], rstud[~flag], s=size[~flag], color="#007AFF", alpha=0.35,
           edgecolor="#007AFF", lw=0.8)
ax.scatter(lev[flag], rstud[flag], s=size[flag], color="#FF3B30", alpha=0.35,
           edgecolor="#FF3B30", lw=1.2)
for i in np.flatnonzero(flag):
    right = lev[i] > 0.5                          # far-right points: label on the left
    ax.annotate(f"{df.index[i]}\nD = {cook[i]:.2f}", (lev[i], rstud[i]),
                xytext=((-1 if right else 1) * (np.sqrt(size[i]) / 2 + 6), 0),
                textcoords="offset points", ha="right" if right else "left", va="center",
                fontsize=8.5, color="#3A3A3C", linespacing=1.1)

# Bubble-size key
for d, x in zip((0.1, 0.5, 1, 2), (0.455, 0.50, 0.55, 0.61)):
    ax.scatter(x, 0.86, s=area(d), transform=ax.transAxes, color="none",
               edgecolor="#8E8E93", lw=0.8)
    ax.text(x, 0.77, f"{d:g}", transform=ax.transAxes, ha="center", fontsize=8.5, color="#6E6E73")
ax.text(0.53, 0.97, "Cook's D", transform=ax.transAxes, ha="center", va="top",
        fontsize=8.5, color="#6E6E73")

ax.set_ylim(rstud.min() - 0.8, rstud.max() + 1.2)
ax.set_xlim(0, lev.max() * 1.15)
ax.set_xlabel("Leverage (hat value)")
ax.set_ylabel("Studentized residual")
ax.set_title("DC and Hawaii combine high leverage with large residuals", pad=26)

# Bonferroni outlier test on the largest |studentized residual|
k = np.argmax(np.abs(rstud))
p_bonf = min(1, n * 2 * stats.t.sf(abs(rstud[k]), model.df_resid - 1))
ax.text(0, 1.02, f"OLS murder rate ~ 5 predictors · n = {n} · {flag.sum()} obs. with Cook's D > 4/n · "
        f"largest |t*| = {abs(rstud[k]):.2f} ({df.index[k]}), Bonferroni p = {p_bonf:.3f}",
        transform=ax.transAxes, fontsize=9.5, color="#6E6E73")
plt.show()
Figures use the optional PyStatlas style: add plt.style.use("pystatlas.mplstyle") to match the look exactly.
Data source
- US state crime and social indicators, 2009. U.S. Census Bureau. Statistical Abstract of the United States, state tables for 2009 (crime rates from the FBI Uniform Crime Reporting program). https://www.statsmodels.org/stable/datasets/generated/statecrime.html
Compiled for statsmodels (sm.datasets.statecrime); public domain. See the statsmodels page for each variable's table and footnotes.
The examples illustrate statistical methods. Their titles describe what each figure shows in these particular data — often a small, dated or partial sample — not the author's position on the substantive question. For interpretation, context and data quality, rely on the original sources cited here.
How to cite
PyStatlas is created and maintained by Thierry Warin. If it helped your work, please cite it.
Warin, T. (2026). Influence plot. In PyStatlas: A Python Gallery of Statistical Graphics for the Social Sciences. https://warint.github.io/pystatlas/model-diagnostics/influence-plot/
@misc{warin2026statlas,
  author       = {Warin, Thierry},
  title        = {PyStatlas: A Python Gallery of Statistical Graphics for the Social Sciences},
  year         = {2026},
  howpublished = {\url{https://warint.github.io/pystatlas/}},
  note         = {Source code: https://github.com/warint/pystatlas}
}More in Model diagnostics
Residual diagnostics
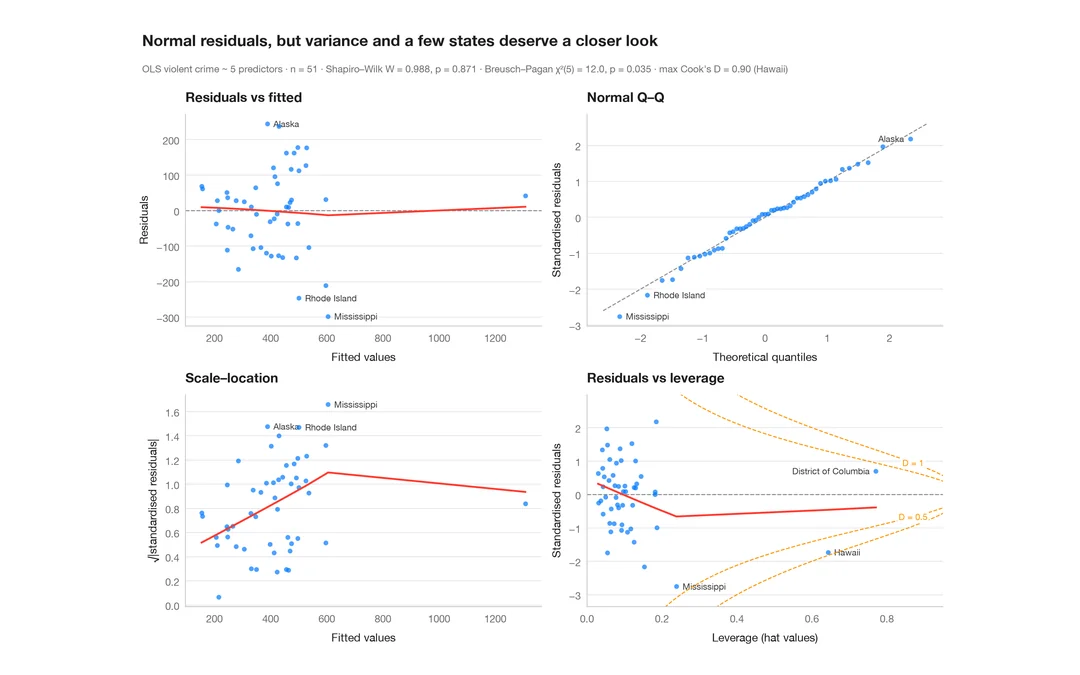
The classic 2 × 2 panel for a linear model — linearity, normality, variance, leverage.
plot(lm) / performance::check_model()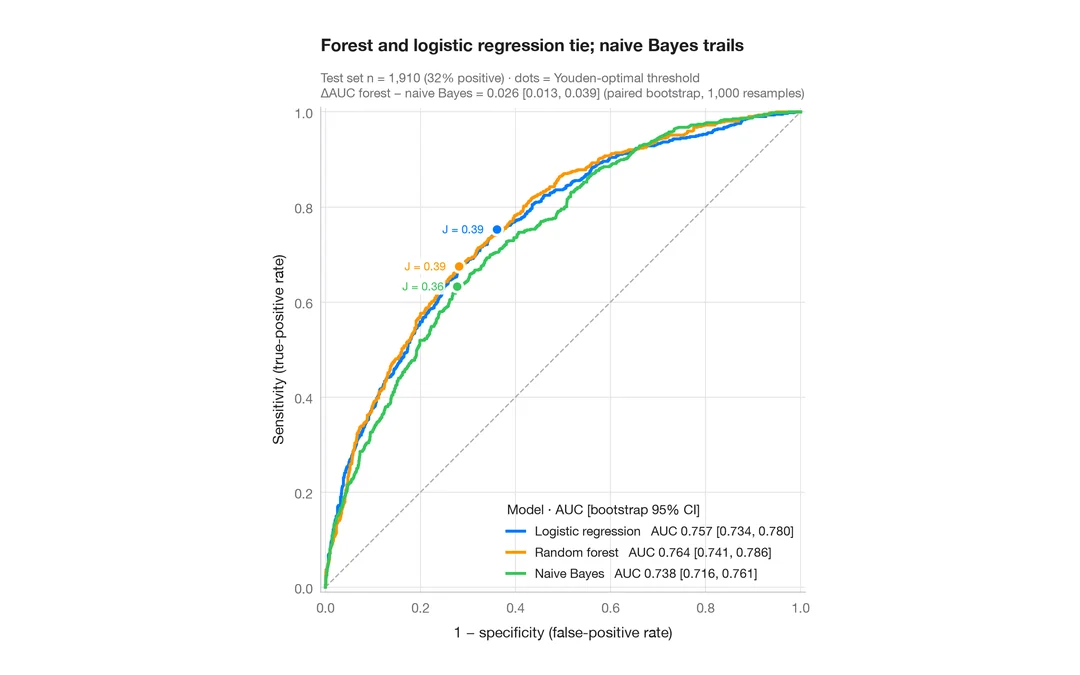
ROC curves
Three classifiers compared by ROC curve, AUC with bootstrap 95% CI and Youden point.
pROC::ggroc() / pROC::ci.auc()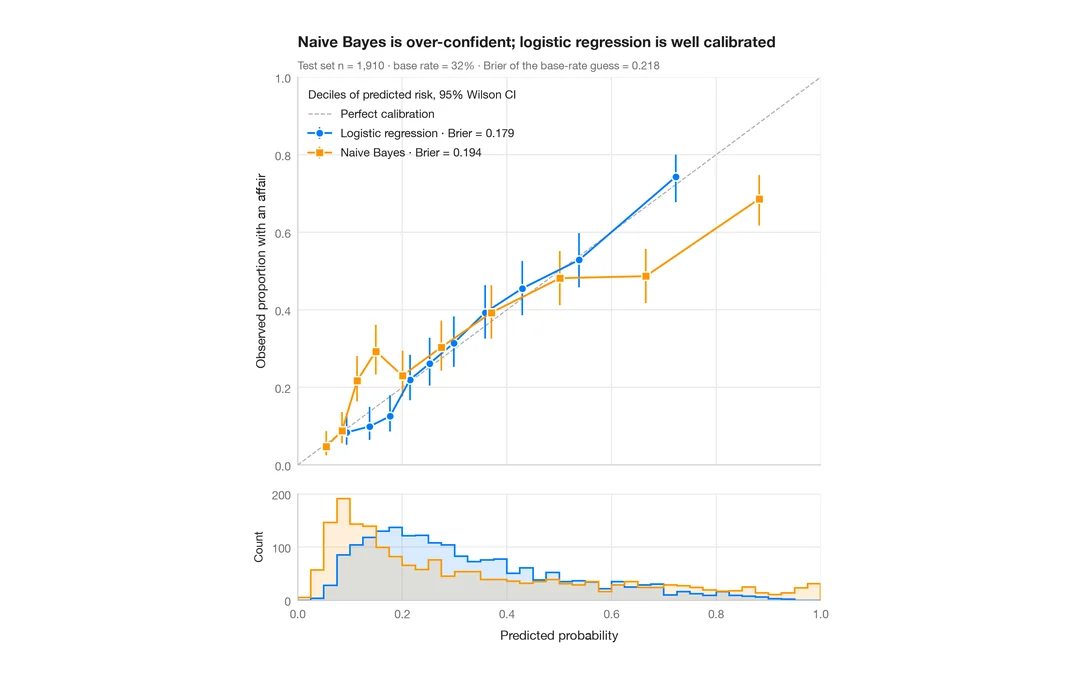
Calibration plot
Predicted vs observed risk per decile, with Wilson CIs, prediction histograms and Brier score.
rms::calibrate() / probably::cal_plot_breaks()