累積ハザード
4 つの政治体制について、退任の Nelson–Aalen 累積ハザードを 95% 信頼帯とともに示します。
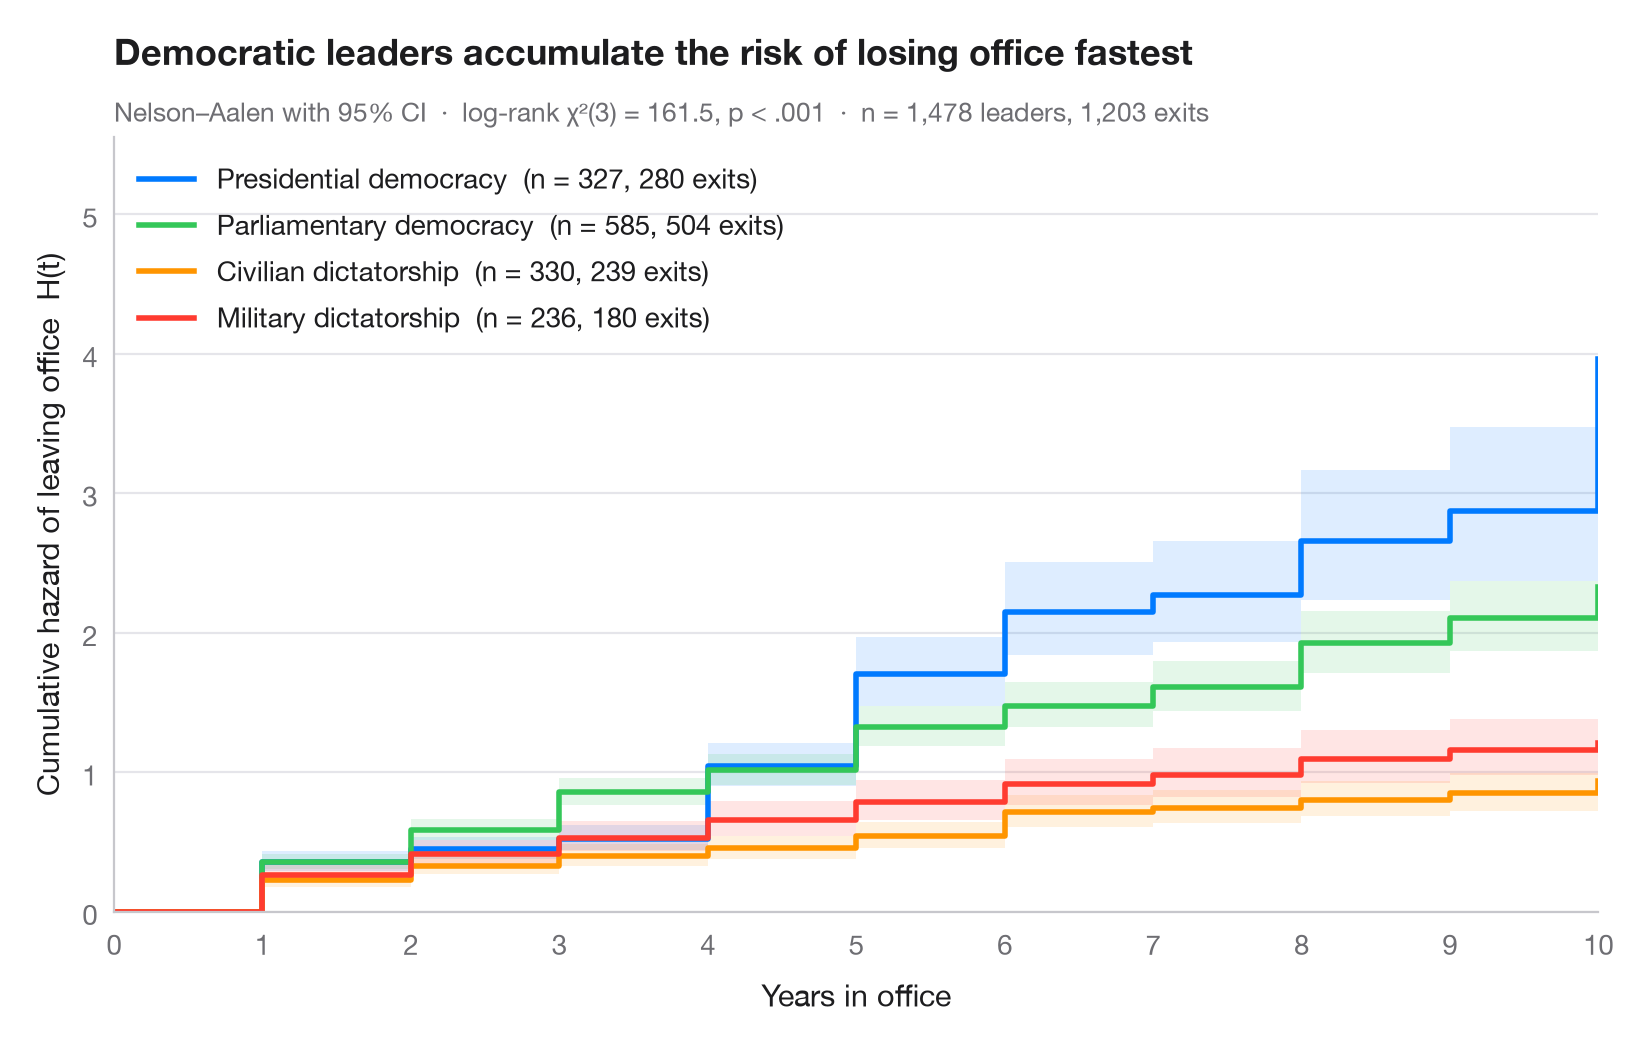
累積ハザード H(t) は、イベントの瞬間的なリスクを時間にわたって足し合わせたもので、「これまでに蓄積されたリスク」を表し、S(t) = exp(−H(t)) によって生存関数と結び付いています。生存曲線と異なり 1 で上限が抑えられることはなく、その 傾き がハザードそのものです。直線ならリスクは一定、上向きに曲がる曲線なら時間とともにリスクが増加していることを意味します。
データは lifelines に同梱されている Cheibub, Gandhi & Vreeland の Democracy and Dictatorship データセット(lifelines.datasets.load_dd)で、1946–2008 年の政府首脳の在任年数を、主要な 4 つの体制について用いています(1,808 件中 1,478 件。混合型民主制と君主制は除外)。曲線は lifelines.NelsonAalenFitter によるもので、サブタイトルには 4 体制間のログランク検定(multivariate_logrank_test)を示しています。民主制の曲線は急に上昇し、大統領制の曲線は大きな段差を描きます。これは固定任期と任期制限の痕跡です。一方、独裁制の曲線は低くほぼ直線的で、リスクが低くほぼ一定であることを示します。横軸は 10 年で止めています。それ以降もリスクにさらされている大統領はごくわずかだからです。
コードおよび図中のテキストは英語です。
import matplotlib.pyplot as plt
from lifelines import NelsonAalenFitter
from lifelines.datasets import load_dd
from lifelines.statistics import multivariate_logrank_test

# Data: years in office of political leaders, four regime types
regimes = {"Presidential Dem": "Presidential democracy", "Parliamentary Dem": "Parliamentary democracy",
           "Civilian Dict": "Civilian dictatorship", "Military Dict": "Military dictatorship"}
df = load_dd()
df = df[df.regime.isin(regimes)]
colors = ["#007AFF", "#34C759", "#FF9500", "#FF3B30"]

fig, ax = plt.subplots(figsize=(8, 5))

# Nelson–Aalen estimate with 95% CI, one curve per regime
for g, c in zip(regimes, colors):
    d = df[df.regime == g]
    naf = NelsonAalenFitter().fit(d.duration, d.observed, label=g)
    # Show the first 10 years only: beyond that only a handful of presidents remain at risk
    H, ci = naf.cumulative_hazard_[g].loc[:10], naf.confidence_interval_.loc[:10]
    H.loc[10], ci.loc[10] = H.iloc[-1], ci.iloc[-1]
    ax.step(H.index, H, where="post", color=c, lw=2,
            label=f"{regimes[g]}  (n = {len(d)}, {d.observed.sum()} exits)")
    ax.fill_between(ci.index, ci.iloc[:, 0], ci.iloc[:, 1], step="post", color=c, alpha=0.13, lw=0)

# Log-rank test across grades
lr = multivariate_logrank_test(df.duration, df.regime, df.observed)
p_txt = "p < .001" if lr.p_value < 0.001 else f"p = {lr.p_value:.3f}"
ax.legend(loc="upper left")
ax.set(xlabel="Years in office", ylabel="Cumulative hazard of leaving office  H(t)", xlim=(0, 10),
       xticks=range(11), ylim=(0, None))
ax.set_title("Democratic leaders accumulate the risk of losing office fastest", pad=26)
ax.text(0, 1.02, f"Nelson–Aalen with 95% CI  ·  log-rank χ²({lr.degrees_of_freedom}) = "
        f"{lr.test_statistic:.1f}, {p_txt}  ·  n = {len(df):,} leaders, {df.observed.sum():,} exits",
        transform=ax.transAxes, fontsize=9.5, color="#6E6E73")
plt.show()
図にはオプションの PyStatlas スタイル を使用しています。同じ見た目にするには plt.style.use("pystatlas.mplstyle") を追加してください。
データの出典
- Democracy and Dictatorship: leader spells, 1946–2008. Cheibub, J. A., Gandhi, J., & Vreeland, J. R. (2010). Democracy and dictatorship revisited. Public Choice, 143(1–2), 67–101. https://doi.org/10.1007/s11127-009-9491-2
202 countries; distributed with lifelines (lifelines.datasets.load_dd).
これらの例は統計手法を説明するためのものです。図のタイトルは、この特定のデータ(多くは小規模で、古く、部分的な標本)で図が示す内容を述べたものであり、実質的な問いに対する著者の立場ではありません。解釈、背景、データの質については、ここに挙げた元の出典を参照してください。
引用方法
PyStatlas は Thierry Warin が作成・運営しています。研究や業務に役立った場合は、ぜひ引用してください。
Warin, T. (2026). Cumulative hazard. In PyStatlas: A Python Gallery of Statistical Graphics for the Social Sciences. https://warint.github.io/pystatlas/survival/cumulative-hazard/
@misc{warin2026statlas,
  author       = {Warin, Thierry},
  title        = {PyStatlas: A Python Gallery of Statistical Graphics for the Social Sciences},
  year         = {2026},
  howpublished = {\url{https://warint.github.io/pystatlas/}},
  note         = {Source code: https://github.com/warint/pystatlas}
}