累积风险
四种政治体制下离任的 Nelson–Aalen 累积风险,附 95% 置信带。
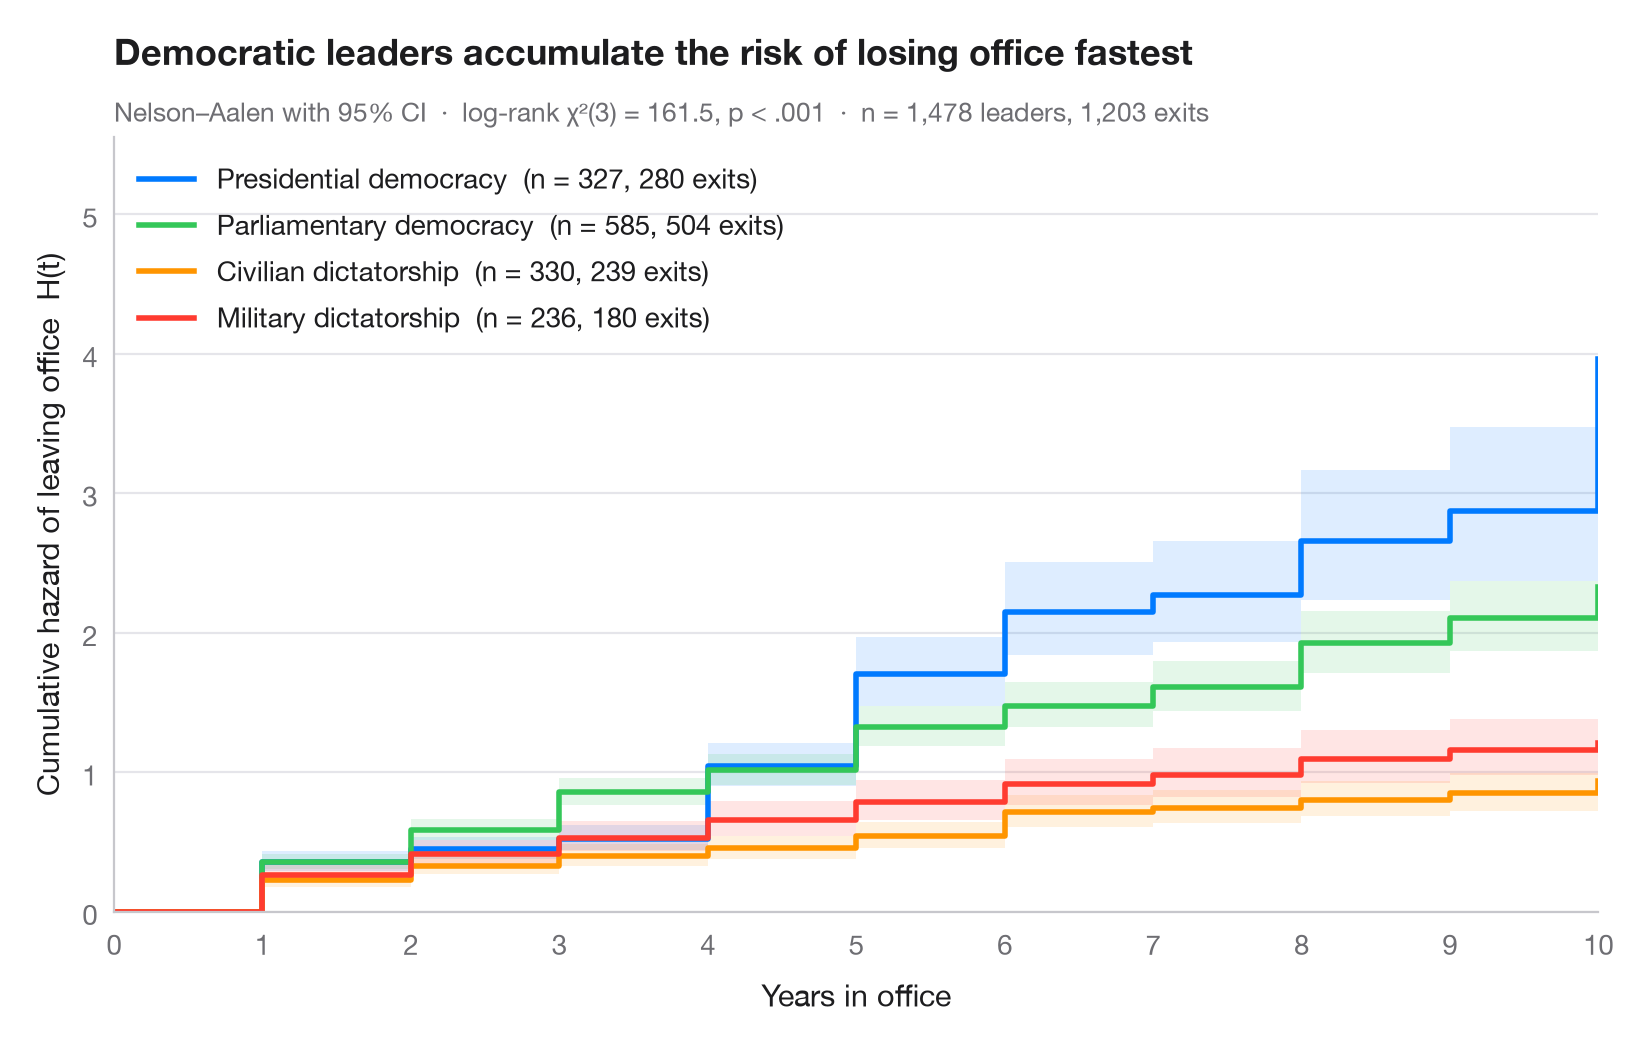
累积风险 H(t) 将事件的瞬时风险随时间累加;它是“迄今为止累积的风险”,并通过 S(t) = exp(−H(t)) 与生存函数相联系。与生存曲线不同,它不以 1 为上界,其斜率就是风险本身——直线意味着风险恒定,向上弯曲的曲线则意味着风险随时间增长。
数据为 lifelines 自带的 Cheibub、Gandhi 和 Vreeland 的 Democracy and Dictatorship 数据集(lifelines.datasets.load_dd):1946–2008 年间政府首脑的在任年数,取四种最主要的体制类型(1,808 段任期中的 1,478 段;混合民主制和君主制未纳入)。曲线来自 lifelines.NelsonAalenFitter,副标题报告四种体制之间的 log-rank 检验(multivariate_logrank_test)。民主体制的曲线上升陡峭,总统制曲线呈大台阶式上升——这是固定任期和任期限制留下的印记;而独裁体制的曲线低且近乎直线,即风险较低且大致恒定。横轴截止于十年,此后仍处于风险中的总统寥寥无几。
代码及图中文字均为英文。
import matplotlib.pyplot as plt
from lifelines import NelsonAalenFitter
from lifelines.datasets import load_dd
from lifelines.statistics import multivariate_logrank_test

# Data: years in office of political leaders, four regime types
regimes = {"Presidential Dem": "Presidential democracy", "Parliamentary Dem": "Parliamentary democracy",
           "Civilian Dict": "Civilian dictatorship", "Military Dict": "Military dictatorship"}
df = load_dd()
df = df[df.regime.isin(regimes)]
colors = ["#007AFF", "#34C759", "#FF9500", "#FF3B30"]

fig, ax = plt.subplots(figsize=(8, 5))

# Nelson–Aalen estimate with 95% CI, one curve per regime
for g, c in zip(regimes, colors):
    d = df[df.regime == g]
    naf = NelsonAalenFitter().fit(d.duration, d.observed, label=g)
    # Show the first 10 years only: beyond that only a handful of presidents remain at risk
    H, ci = naf.cumulative_hazard_[g].loc[:10], naf.confidence_interval_.loc[:10]
    H.loc[10], ci.loc[10] = H.iloc[-1], ci.iloc[-1]
    ax.step(H.index, H, where="post", color=c, lw=2,
            label=f"{regimes[g]}  (n = {len(d)}, {d.observed.sum()} exits)")
    ax.fill_between(ci.index, ci.iloc[:, 0], ci.iloc[:, 1], step="post", color=c, alpha=0.13, lw=0)

# Log-rank test across grades
lr = multivariate_logrank_test(df.duration, df.regime, df.observed)
p_txt = "p < .001" if lr.p_value < 0.001 else f"p = {lr.p_value:.3f}"
ax.legend(loc="upper left")
ax.set(xlabel="Years in office", ylabel="Cumulative hazard of leaving office  H(t)", xlim=(0, 10),
       xticks=range(11), ylim=(0, None))
ax.set_title("Democratic leaders accumulate the risk of losing office fastest", pad=26)
ax.text(0, 1.02, f"Nelson–Aalen with 95% CI  ·  log-rank χ²({lr.degrees_of_freedom}) = "
        f"{lr.test_statistic:.1f}, {p_txt}  ·  n = {len(df):,} leaders, {df.observed.sum():,} exits",
        transform=ax.transAxes, fontsize=9.5, color="#6E6E73")
plt.show()
图表使用了可选的 PyStatlas 样式:添加 plt.style.use("pystatlas.mplstyle") 即可完全还原其外观。
数据来源
- Democracy and Dictatorship: leader spells, 1946–2008. Cheibub, J. A., Gandhi, J., & Vreeland, J. R. (2010). Democracy and dictatorship revisited. Public Choice, 143(1–2), 67–101. https://doi.org/10.1007/s11127-009-9491-2
202 countries; distributed with lifelines (lifelines.datasets.load_dd).
这些示例用于说明统计方法。图表标题描述的是该图在这些特定数据中呈现的内容——这些数据往往样本较小、年代较早或并不完整——而不是作者对实质问题的立场。关于解释、背景和数据质量,请以此处引用的原始来源为准。
如何引用
PyStatlas 由 Thierry Warin 创建并维护。如果它对你的工作有所帮助,敬请引用。
Warin, T. (2026). Cumulative hazard. In PyStatlas: A Python Gallery of Statistical Graphics for the Social Sciences. https://warint.github.io/pystatlas/survival/cumulative-hazard/
@misc{warin2026statlas,
  author       = {Warin, Thierry},
  title        = {PyStatlas: A Python Gallery of Statistical Graphics for the Social Sciences},
  year         = {2026},
  howpublished = {\url{https://warint.github.io/pystatlas/}},
  note         = {Source code: https://github.com/warint/pystatlas}
}