発散型リッカートチャート
5件法のリッカート項目を、中立の回答を中心とした発散型積み上げ棒で示します。
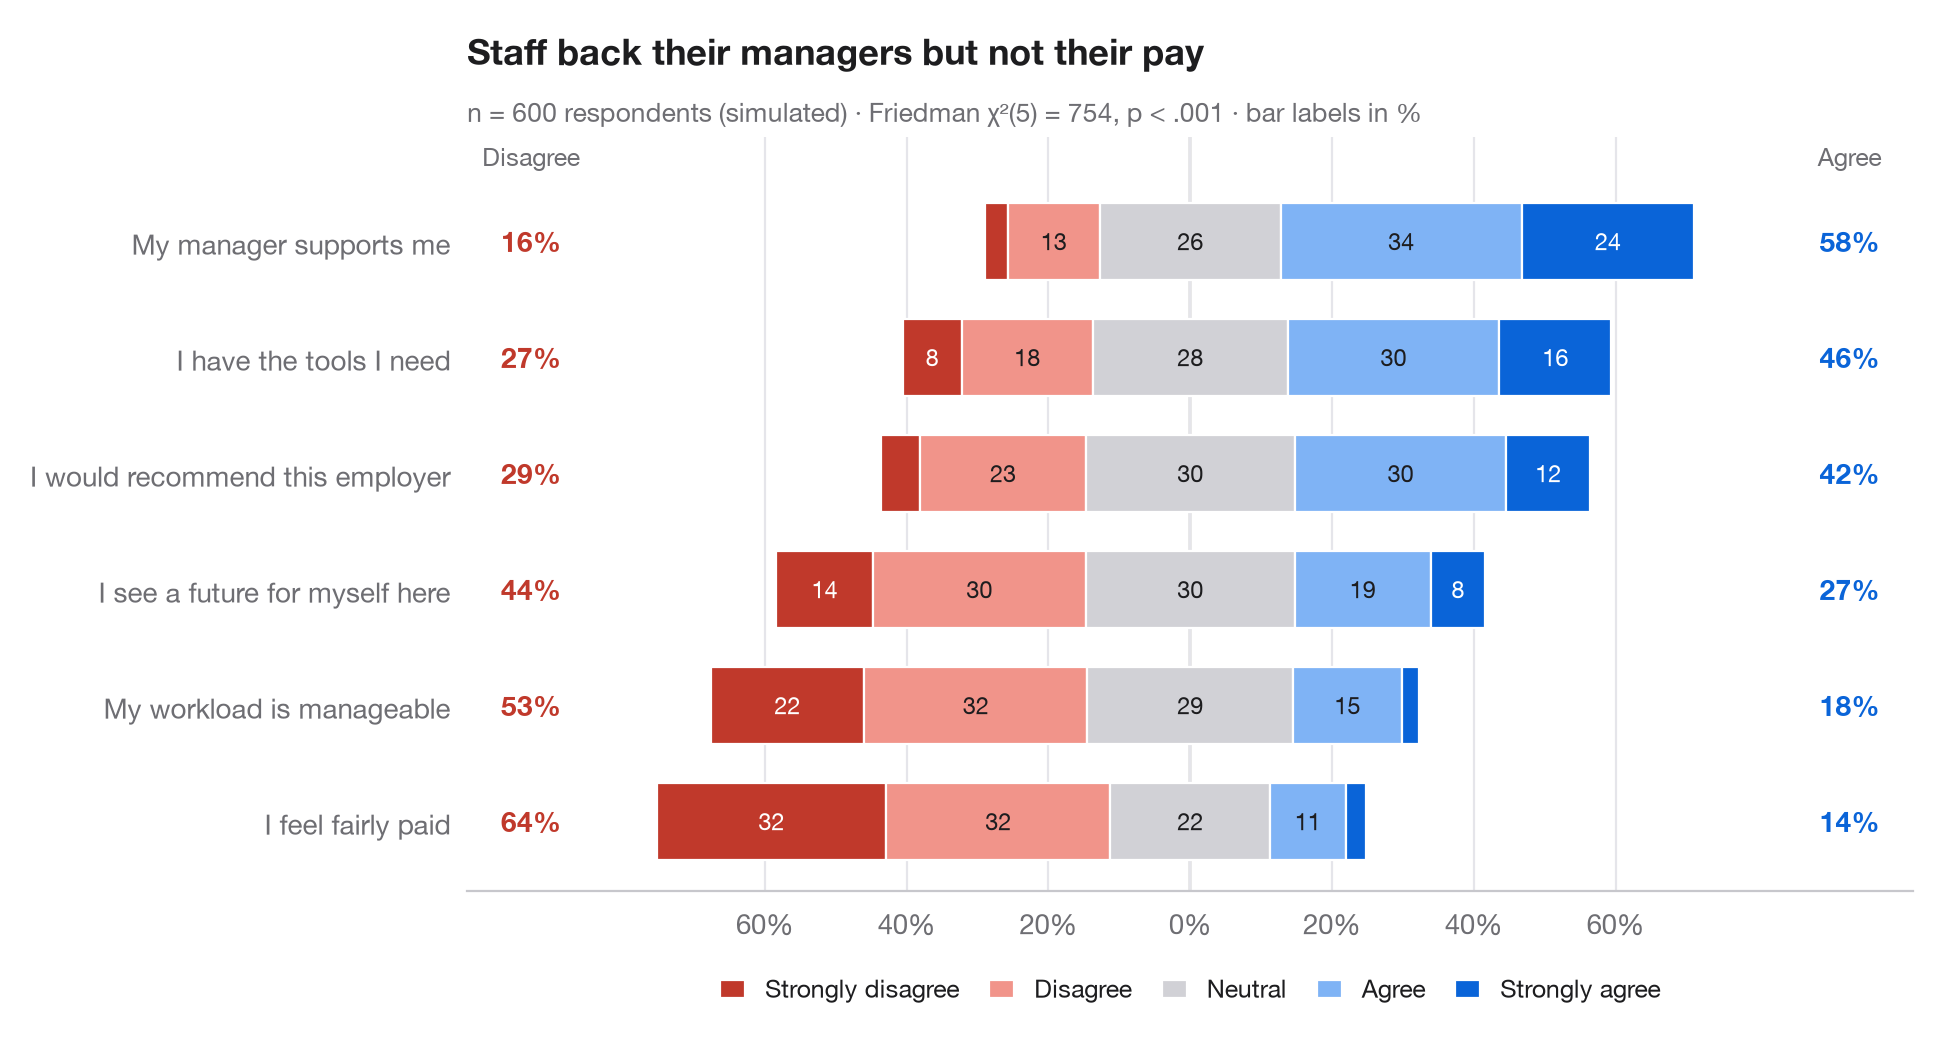
gglikert() の Python 版です。各行が1つの調査項目で、棒は5段階の回答に分割され、中立 の回答がゼロをまたぐように配置されています。否定的な回答は左へ、肯定的な回答は右へ伸びます。項目は肯定的回答の合計順に並べ、左右の列には否定的回答(左)と肯定的回答(右)の合計割合を示しているため、各区分を読み取らなくても行どうしを比較できます。
データはシード固定のシミュレーションで、従業員 600 人が職場に関する6つの記述に回答したものです。割合は pd.crosstab(normalize="index") で求めています。サブタイトルには、同じ回答者から得た各項目の回答分布が等しいかどうかを調べる フリードマン検定(scipy.stats.friedmanchisquare)の結果を示しています。
コードおよび図中のテキストは英語です。
import matplotlib.pyplot as plt
import numpy as np
import pandas as pd
from scipy import stats

# Simulated survey: 600 respondents, 6 items, answers 1-5 driven by a shared latent mood
rng = np.random.default_rng(42)
items = {"My workload is manageable": -0.6, "I have the tools I need": 0.4,
         "My manager supports me": 0.8, "I feel fairly paid": -1.0,
         "I would recommend this employer": 0.2, "I see a future for myself here": -0.2}
mood = rng.normal(0, 0.8, 600)
answers = pd.DataFrame({item: np.digitize(shift + mood + rng.normal(0, 1, 600),
                                          [-1.6, -0.5, 0.5, 1.6]) + 1
                        for item, shift in items.items()})

levels = ["Strongly disagree", "Disagree", "Neutral", "Agree", "Strongly agree"]
colors = ["#C0392B", "#F1948A", "#D1D1D6", "#7FB3F5", "#0A64D8"]
pct = answers.melt().pipe(lambda d: pd.crosstab(d.variable, d.value, normalize="index") * 100)
pct["agree"], pct["disagree"] = pct[4] + pct[5], pct[1] + pct[2]
pct = pct.sort_values("agree")

# Friedman test: do the six items get the same answers from the same people?
fr = stats.friedmanchisquare(*[answers[c] for c in answers])

fig, ax = plt.subplots(figsize=(9.5, 5))
y = np.arange(len(pct))
left = -(pct[1] + pct[2] + pct[3] / 2)              # start so that neutral is centred on 0
for lev, (name, c) in enumerate(zip(levels, colors), start=1):
    ax.barh(y, pct[lev], left=left, color=c, height=0.66, label=name, edgecolor="white", lw=0.8)
    for yi, (l, w) in enumerate(zip(left, pct[lev])):
        if w >= 6:
            ax.text(l + w / 2, yi, f"{w:.0f}", ha="center", va="center", fontsize=8.5,
                    color="white" if lev in (1, 5) else "#1D1D1F")
    left = left + pct[lev]

# Totals on both sides
for yi, (d, a) in enumerate(zip(pct["disagree"], pct["agree"])):
    ax.text(-93, yi, f"{d:.0f}%", ha="center", va="center", fontsize=10, color="#C0392B", fontweight="semibold")
    ax.text(93, yi, f"{a:.0f}%", ha="center", va="center", fontsize=10, color="#0A64D8", fontweight="semibold")
ax.text(-93, len(pct) - 0.35, "Disagree", ha="center", fontsize=9, color="#6E6E73")
ax.text(93, len(pct) - 0.35, "Agree", ha="center", fontsize=9, color="#6E6E73")

ax.axvline(0, color="#3A3A3C", lw=0.8, zorder=0)
ax.spines["left"].set_visible(False)
ax.set_yticks(y, pct.index)
ax.set_xlim(-102, 102)
ax.set_ylim(-0.6, len(pct) - 0.1)
ax.set_xticks(range(-60, 61, 20), [f"{abs(t)}%" for t in range(-60, 61, 20)])
ax.grid(axis="x"); ax.grid(axis="y", visible=False)
ax.legend(ncols=5, loc="upper center", bbox_to_anchor=(0.5, -0.08), fontsize=9,
          handlelength=1, columnspacing=1.2)
ax.set_title("Staff back their managers but not their pay", pad=26)
ax.text(0, 1.02, f"n = {len(answers)} respondents (simulated) · Friedman χ²({answers.shape[1] - 1}) = "
        f"{fr.statistic:.0f}, p < .001 · bar labels in %", transform=ax.transAxes,
        fontsize=9.5, color="#6E6E73")
plt.show()
図にはオプションの PyStatlas スタイル を使用しています。同じ見た目にするには plt.style.use("pystatlas.mplstyle") を追加してください。
データの出典
- Simulated data. Simulated data with a fixed random seed, created for this example.
No real respondents, documents or measurements: the numbers only illustrate how the chart and its statistics work.
これらの例は統計手法を説明するためのものです。図のタイトルは、この特定のデータ(多くは小規模で、古く、部分的な標本)で図が示す内容を述べたものであり、実質的な問いに対する著者の立場ではありません。解釈、背景、データの質については、ここに挙げた元の出典を参照してください。
引用方法
PyStatlas は Thierry Warin が作成・運営しています。研究や業務に役立った場合は、ぜひ引用してください。
Warin, T. (2026). Diverging Likert chart. In PyStatlas: A Python Gallery of Statistical Graphics for the Social Sciences. https://warint.github.io/pystatlas/proportions-surveys/likert-diverging/
@misc{warin2026statlas,
  author       = {Warin, Thierry},
  title        = {PyStatlas: A Python Gallery of Statistical Graphics for the Social Sciences},
  year         = {2026},
  howpublished = {\url{https://warint.github.io/pystatlas/}},
  note         = {Source code: https://github.com/warint/pystatlas}
}