95% 信頼区間の意味
ANES の回答者 944 人から 30 人を抽出する調査を 100 回。平均年齢の 95% 信頼区間のうち真値を外したものを赤で示します。
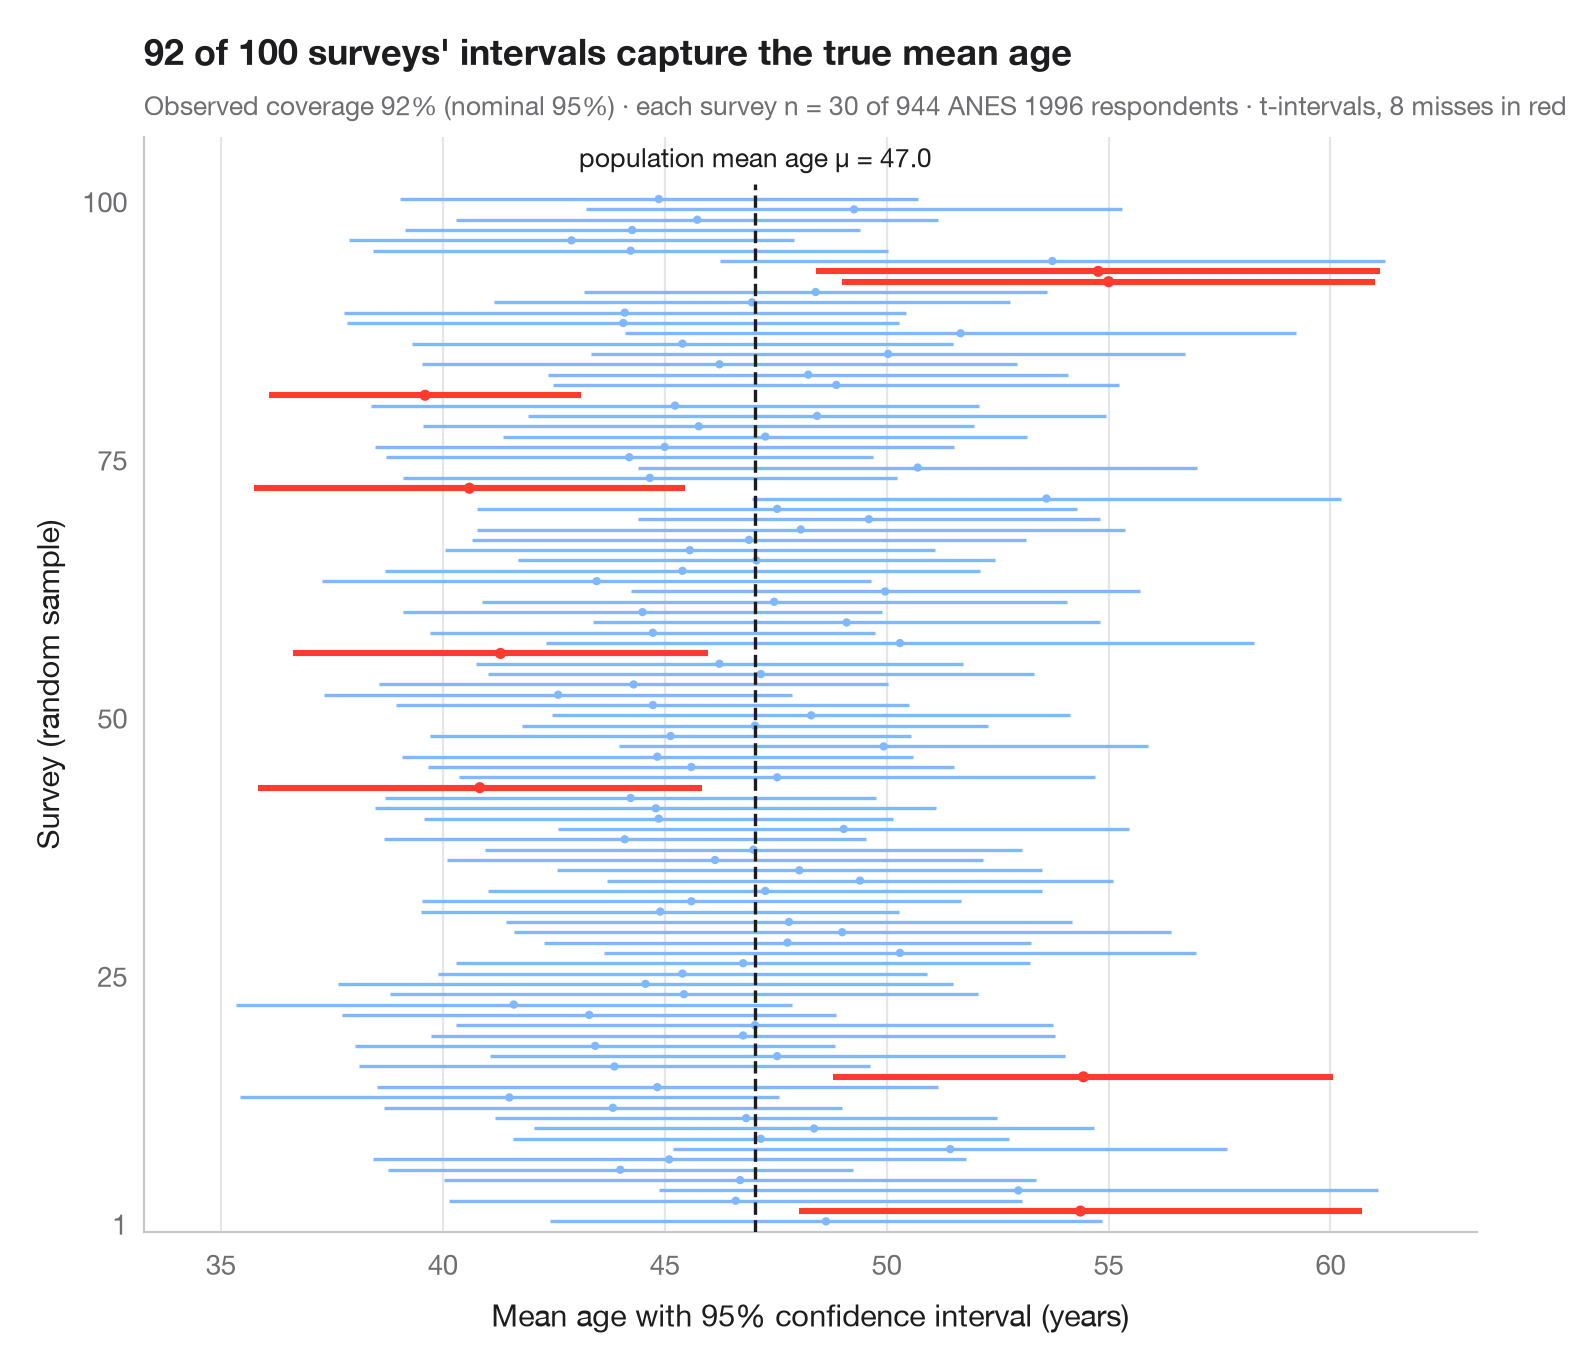
「95% の信頼」は 1 本の区間ではなく手続きの性質です。ここでは 1996 年米国全国選挙調査(statsmodels の anes96)の回答者 944 人を母集団全体とみなすので、その平均年齢が既知の真値になります。同じ小規模調査 — 無作為・非復元で抽出した 30 人 — を 100 回繰り返し、各横線は標本の平均年齢を中心とする 95% の t 区間です。そのうち約 95 本が真の平均(破線)を含み、外れた数本を赤で描いています。各標本が自らの標準偏差を推定するため、区間の幅もばらつきます。
抽出はシードを固定した numpy、区間は scipy.stats.t.interval によります。年齢は右に歪んでおり(19〜91 歳)、100 回の調査 1 セットでは、偶然だけで 95% を数ポイント上回ったり下回ったりすることがあります。
コードおよび図中のテキストは英語です。
import matplotlib.pyplot as plt
import numpy as np
import statsmodels.api as sm
from scipy import stats

# Population: ages of the 944 ANES 1996 respondents; 100 surveys of n = 30 each
age = sm.datasets.anes96.load_pandas().data["age"].to_numpy()
rng = np.random.default_rng(2024)
mu, n, reps = age.mean(), 30, 100
samples = np.array([rng.choice(age, n, replace=False) for _ in range(reps)])
means = samples.mean(axis=1)
se = samples.std(axis=1, ddof=1) / np.sqrt(n)
lo, hi = stats.t.interval(0.95, df=n - 1, loc=means, scale=se)
miss = (lo > mu) | (hi < mu)

fig, ax = plt.subplots(figsize=(8, 6.6))
y = np.arange(1, reps + 1)
colors = np.where(miss, "#FF3B30", "#7FB8FF")
ax.hlines(y, lo, hi, color=colors, lw=np.where(miss, 2.2, 1.2))
ax.scatter(means, y, s=np.where(miss, 16, 9), color=colors, zorder=3, lw=0)
ax.vlines(mu, 0, reps + 1.5, color="#1D1D1F", ls="--", lw=1.2, zorder=4)
ax.text(mu, reps + 2.5, f"population mean age μ = {mu:.1f}", ha="center", va="bottom", fontsize=9.5,
        color="#1D1D1F")

ax.set_ylim(0, reps + 6)
ax.set_yticks([1, 25, 50, 75, 100])
ax.set_ylabel("Survey (random sample)")
ax.set_xlabel("Mean age with 95% confidence interval (years)")
ax.grid(axis="y", visible=False); ax.grid(axis="x")
ax.margins(x=0.08)
ax.set_title(f"{reps - miss.sum()} of {reps} surveys' intervals capture the true mean age", pad=26)
ax.text(0, 1.02, f"Observed coverage {100 * (1 - miss.mean()):.0f}% (nominal 95%) · "
        f"each survey n = {n} of {len(age)} ANES 1996 respondents · t-intervals, {miss.sum()} misses in red",
        transform=ax.transAxes, fontsize=9.5, color="#6E6E73")
plt.show()
図にはオプションの PyStatlas スタイル を使用しています。同じ見た目にするには plt.style.use("pystatlas.mplstyle") を追加してください。
データの出典
- American National Election Study, 1996. Rosenstone, S. J., Kinder, D. R., Miller, W. E., & the National Election Studies. (2016). ANES 1996 Time Series Study (ICPSR 6896; Version 6) [Data set]. Inter-university Consortium for Political and Social Research. https://doi.org/10.3886/ICPSR06896.v6
Subset of 944 respondents distributed with statsmodels (sm.datasets.anes96); public domain.
これらの例は統計手法を説明するためのものです。図のタイトルは、この特定のデータ(多くは小規模で、古く、部分的な標本)で図が示す内容を述べたものであり、実質的な問いに対する著者の立場ではありません。解釈、背景、データの質については、ここに挙げた元の出典を参照してください。
引用方法
PyStatlas は Thierry Warin が作成・運営しています。研究や業務に役立った場合は、ぜひ引用してください。
Warin, T. (2026). What a 95% confidence interval means. In PyStatlas: A Python Gallery of Statistical Graphics for the Social Sciences. https://warint.github.io/pystatlas/inference-uncertainty/confidence-intervals/
@misc{warin2026statlas,
  author       = {Warin, Thierry},
  title        = {PyStatlas: A Python Gallery of Statistical Graphics for the Social Sciences},
  year         = {2026},
  howpublished = {\url{https://warint.github.io/pystatlas/}},
  note         = {Source code: https://github.com/warint/pystatlas}
}推測と不確実性のその他のグラフ
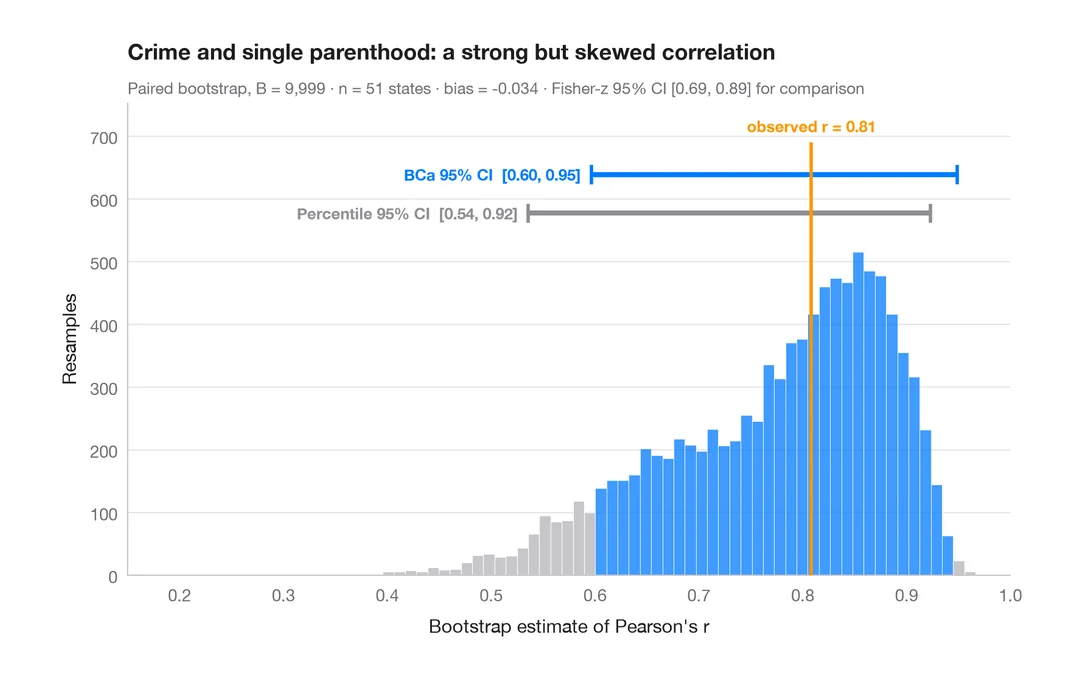
ブートストラップ分布
再標本化した相関係数を、パーセンタイル法と BCa 法の 95% 信頼区間とともに示します。
boot::boot() + boot::boot.ci()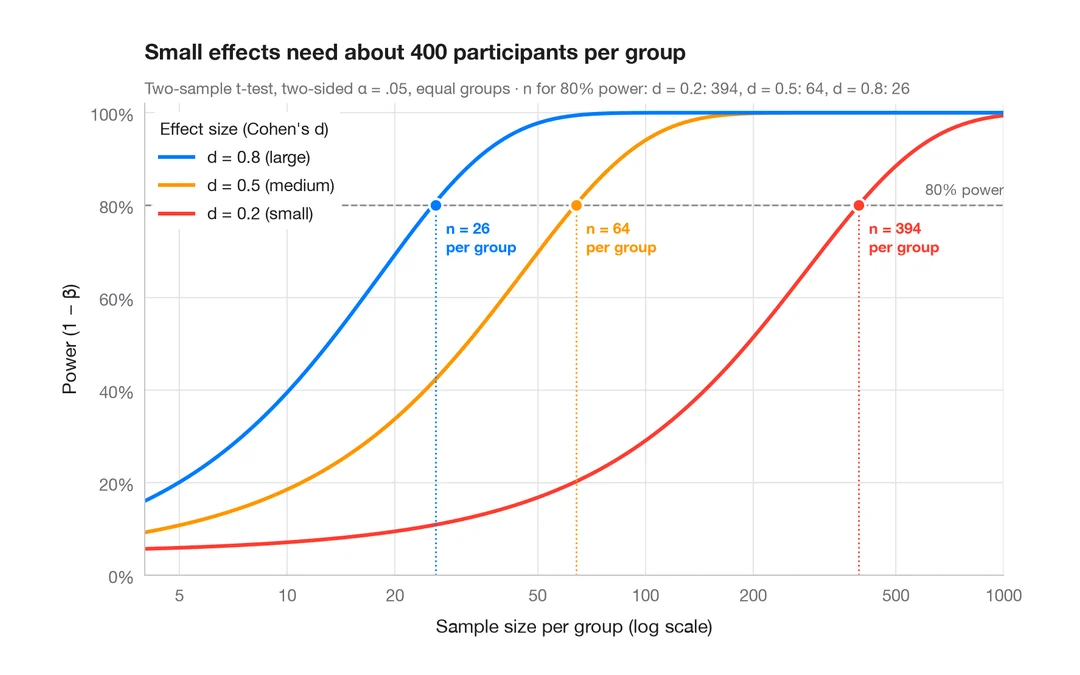
検出力曲線
2標本 t 検定の検出力を、小・中・大の効果量ごとに標本サイズに対して描きます。
pwr::pwr.t.test() + plot()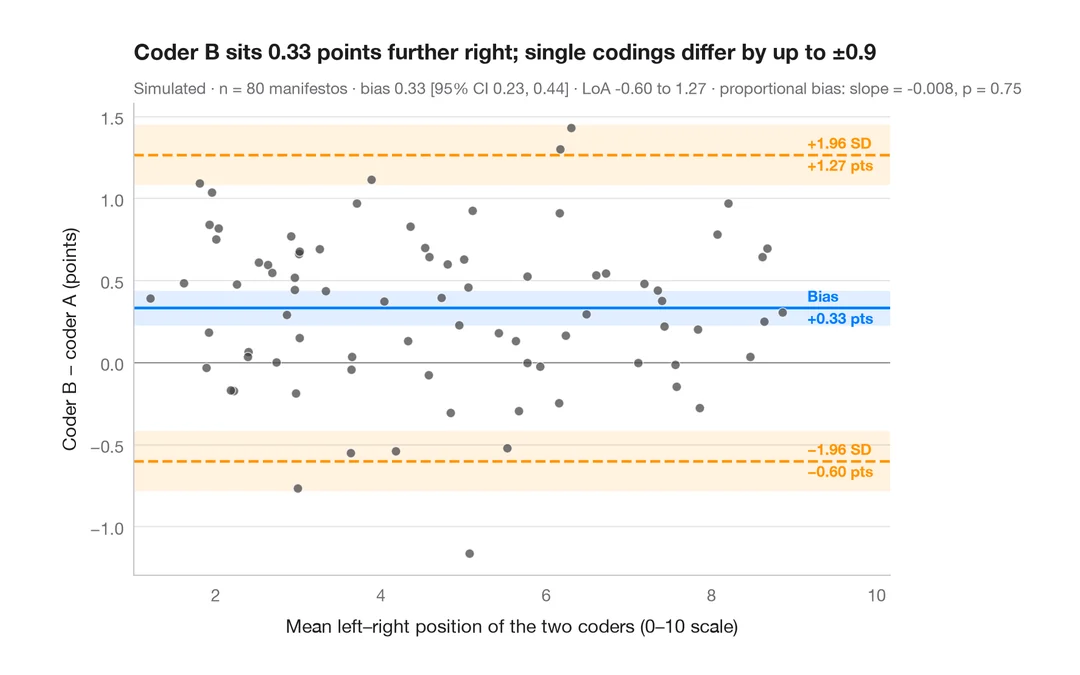
ブランド・アルトマンプロット
2 人のコーダーは政党の選挙綱領を左右軸上に同じように位置づけるか?バイアスと 95% 一致限界。
BlandAltmanLeh::bland.altman.plot() / blandr::blandr.draw()