What a 95% confidence interval means
100 surveys of 30 people drawn from 944 ANES respondents; the 95% CIs for mean age that miss the true value are in red.
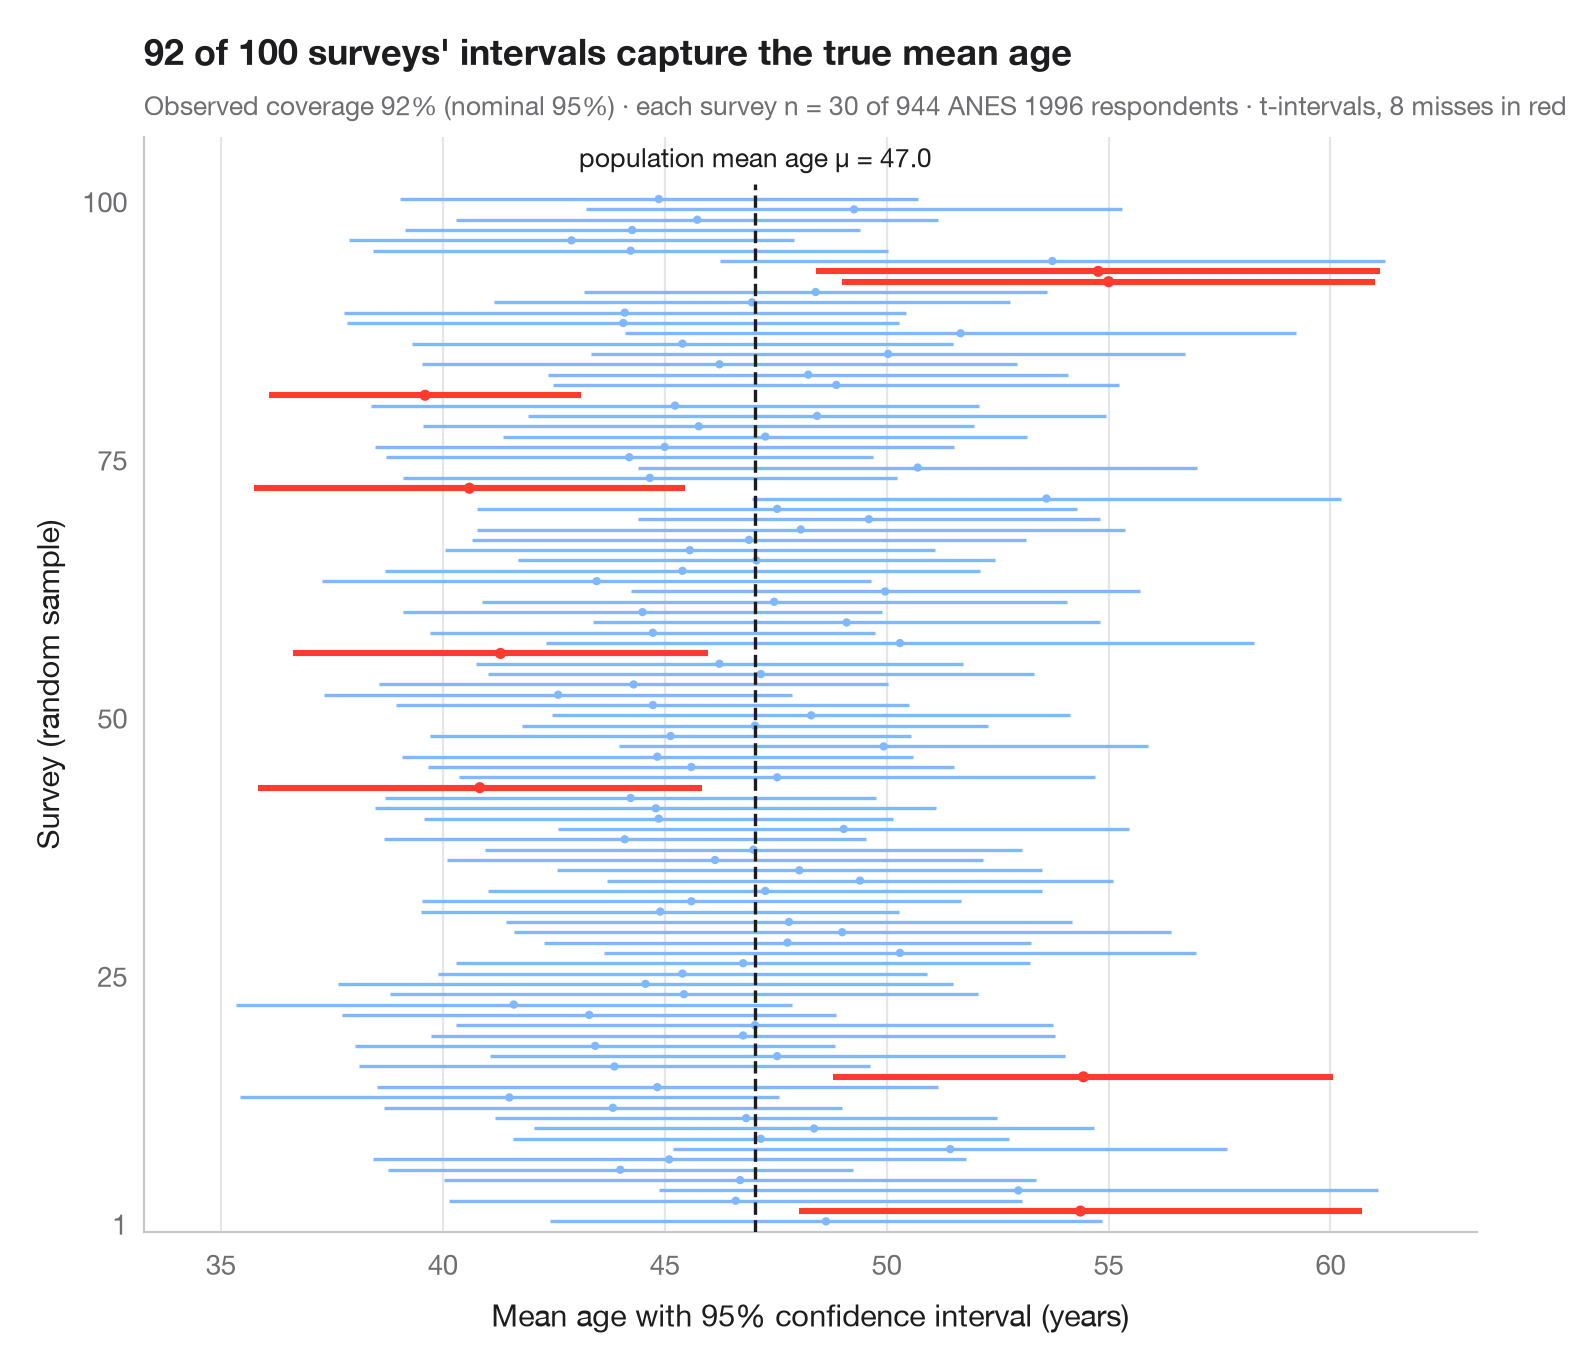
"95% confidence" is a property of the procedure, not of one interval. Here
the 944 respondents of the 1996 American National Election Study (statsmodels
anes96) are treated as the whole population, so their mean age is the known
true value. The same small survey — 30 respondents drawn at random, without
replacement — is repeated 100 times, and each horizontal line is the resulting
95% t-interval around the sample mean age. About 95 of them cover the true
mean (dashed line); the few that miss it are drawn in red. Interval widths
vary too, because each sample estimates its own standard deviation.
The draws are seeded with numpy and the intervals use
scipy.stats.t.interval. Age is right-skewed (19 to 91), and one run of 100
surveys can land a few points above or below 95% by chance alone.
import matplotlib.pyplot as plt
import numpy as np
import statsmodels.api as sm
from scipy import stats

# Population: ages of the 944 ANES 1996 respondents; 100 surveys of n = 30 each
age = sm.datasets.anes96.load_pandas().data["age"].to_numpy()
rng = np.random.default_rng(2024)
mu, n, reps = age.mean(), 30, 100
samples = np.array([rng.choice(age, n, replace=False) for _ in range(reps)])
means = samples.mean(axis=1)
se = samples.std(axis=1, ddof=1) / np.sqrt(n)
lo, hi = stats.t.interval(0.95, df=n - 1, loc=means, scale=se)
miss = (lo > mu) | (hi < mu)

fig, ax = plt.subplots(figsize=(8, 6.6))
y = np.arange(1, reps + 1)
colors = np.where(miss, "#FF3B30", "#7FB8FF")
ax.hlines(y, lo, hi, color=colors, lw=np.where(miss, 2.2, 1.2))
ax.scatter(means, y, s=np.where(miss, 16, 9), color=colors, zorder=3, lw=0)
ax.vlines(mu, 0, reps + 1.5, color="#1D1D1F", ls="--", lw=1.2, zorder=4)
ax.text(mu, reps + 2.5, f"population mean age μ = {mu:.1f}", ha="center", va="bottom", fontsize=9.5,
        color="#1D1D1F")

ax.set_ylim(0, reps + 6)
ax.set_yticks([1, 25, 50, 75, 100])
ax.set_ylabel("Survey (random sample)")
ax.set_xlabel("Mean age with 95% confidence interval (years)")
ax.grid(axis="y", visible=False); ax.grid(axis="x")
ax.margins(x=0.08)
ax.set_title(f"{reps - miss.sum()} of {reps} surveys' intervals capture the true mean age", pad=26)
ax.text(0, 1.02, f"Observed coverage {100 * (1 - miss.mean()):.0f}% (nominal 95%) · "
        f"each survey n = {n} of {len(age)} ANES 1996 respondents · t-intervals, {miss.sum()} misses in red",
        transform=ax.transAxes, fontsize=9.5, color="#6E6E73")
plt.show()
Figures use the optional PyStatlas style: add plt.style.use("pystatlas.mplstyle") to match the look exactly.
Data source
- American National Election Study, 1996. Rosenstone, S. J., Kinder, D. R., Miller, W. E., & the National Election Studies. (2016). ANES 1996 Time Series Study (ICPSR 6896; Version 6) [Data set]. Inter-university Consortium for Political and Social Research. https://doi.org/10.3886/ICPSR06896.v6
Subset of 944 respondents distributed with statsmodels (sm.datasets.anes96); public domain.
The examples illustrate statistical methods. Their titles describe what each figure shows in these particular data — often a small, dated or partial sample — not the author's position on the substantive question. For interpretation, context and data quality, rely on the original sources cited here.
How to cite
PyStatlas is created and maintained by Thierry Warin. If it helped your work, please cite it.
Warin, T. (2026). What a 95% confidence interval means. In PyStatlas: A Python Gallery of Statistical Graphics for the Social Sciences. https://warint.github.io/pystatlas/inference-uncertainty/confidence-intervals/
@misc{warin2026statlas,
  author       = {Warin, Thierry},
  title        = {PyStatlas: A Python Gallery of Statistical Graphics for the Social Sciences},
  year         = {2026},
  howpublished = {\url{https://warint.github.io/pystatlas/}},
  note         = {Source code: https://github.com/warint/pystatlas}
}More in Inference & uncertainty
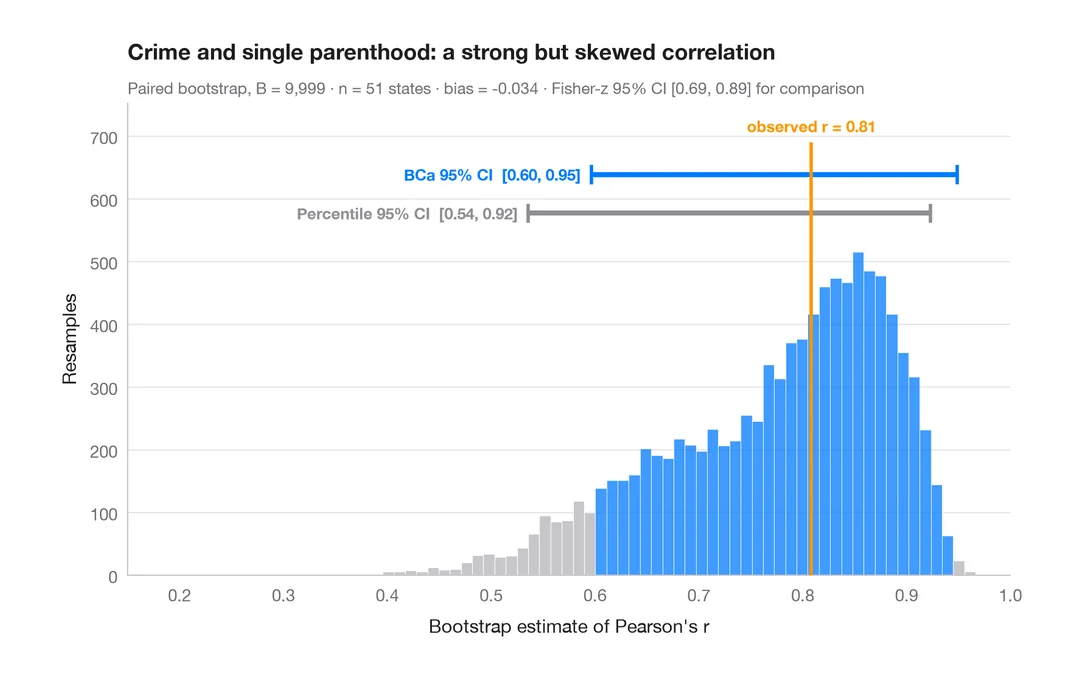
Bootstrap distribution
Resampled correlation with percentile and BCa 95% confidence intervals.
boot::boot() + boot::boot.ci()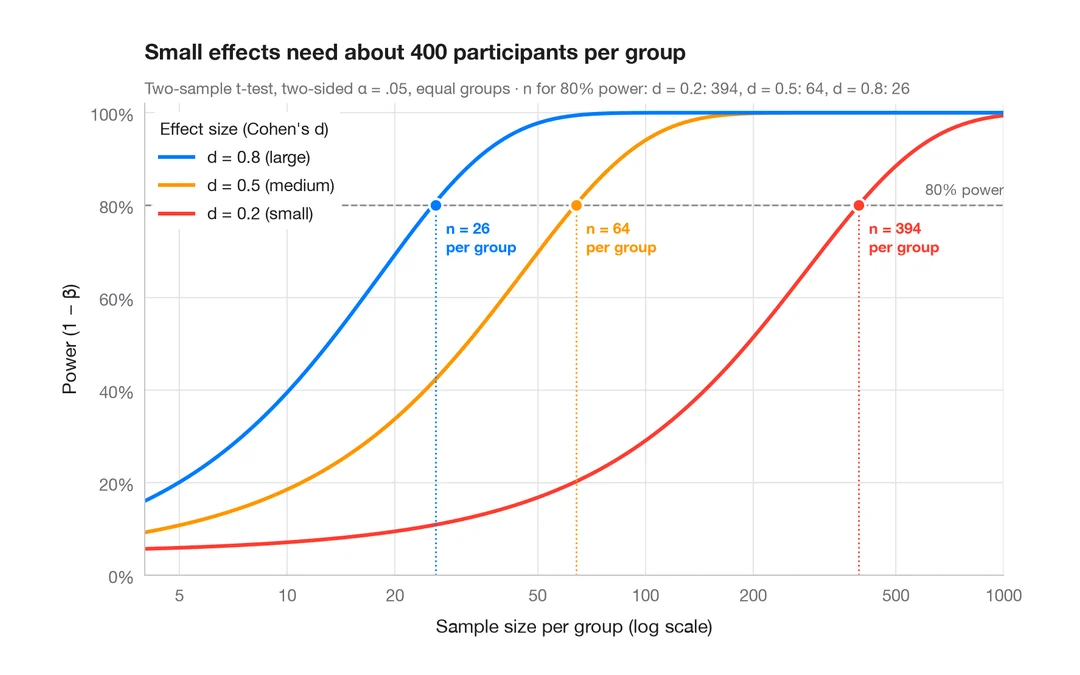
Power curve
Power of a two-sample t-test against sample size for small, medium and large effects.
pwr::pwr.t.test() + plot()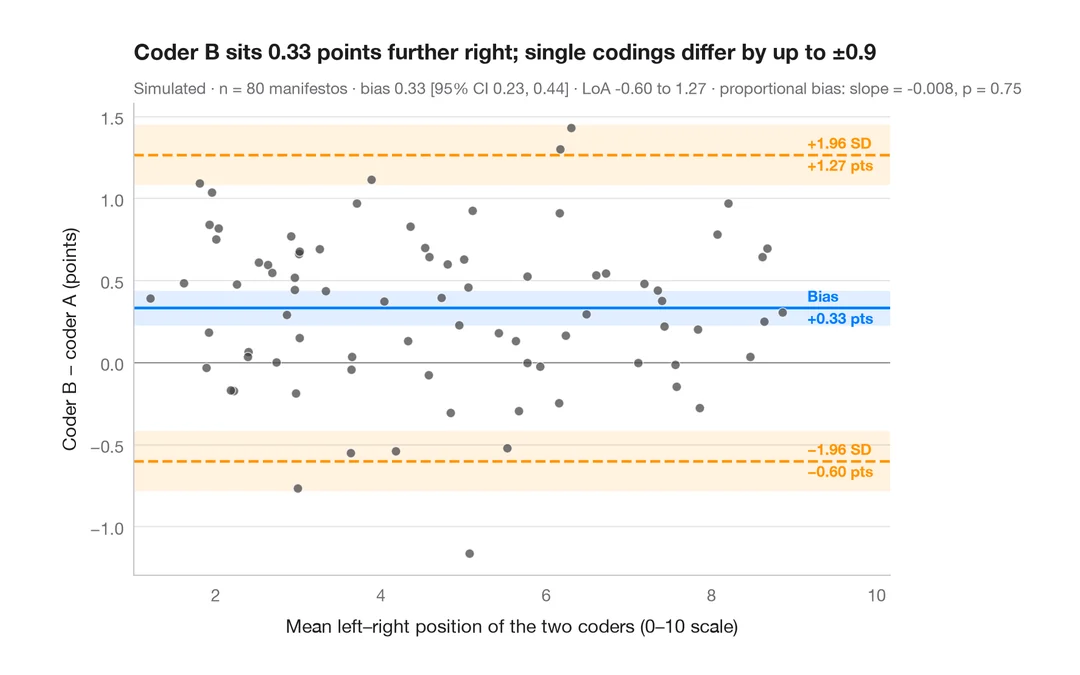
Bland–Altman plot
Do two coders place party manifestos on the left–right scale the same way? Bias and 95% limits of agreement.
BlandAltmanLeh::bland.altman.plot() / blandr::blandr.draw()