Gallery/Distributions
Distributions
See the shape of your data: histograms, densities, ridgelines, ECDFs and Q–Q plots.
Distributions
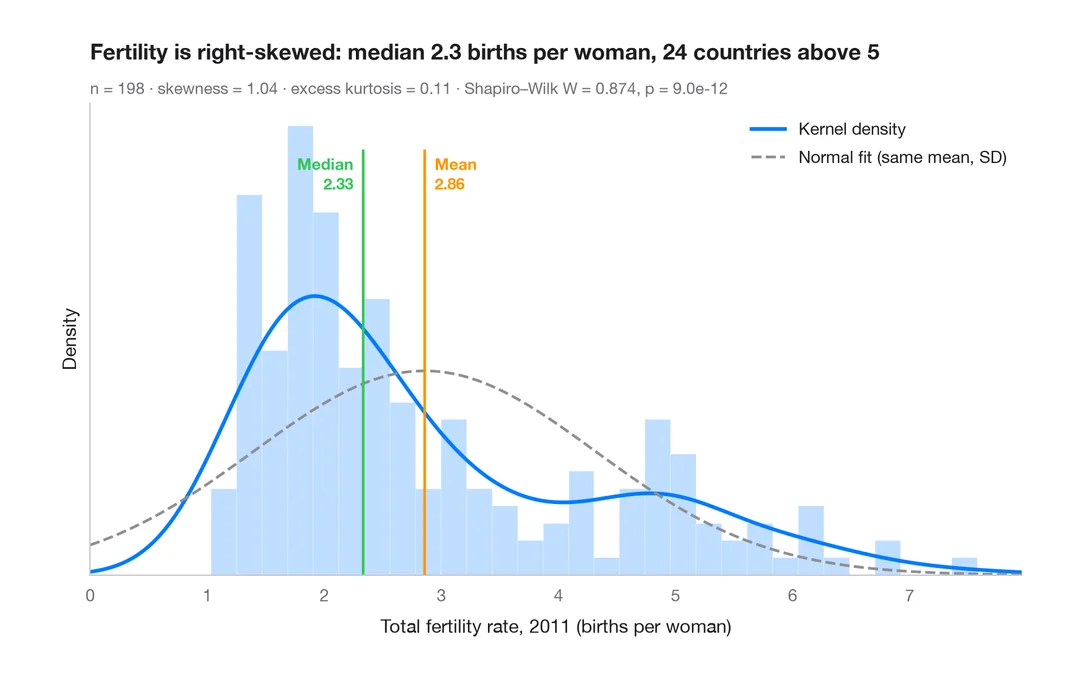
Histogram with density
Histogram, kernel density and fitted normal curve, with shape statistics.
ggplot2::geom_histogram() + geom_density()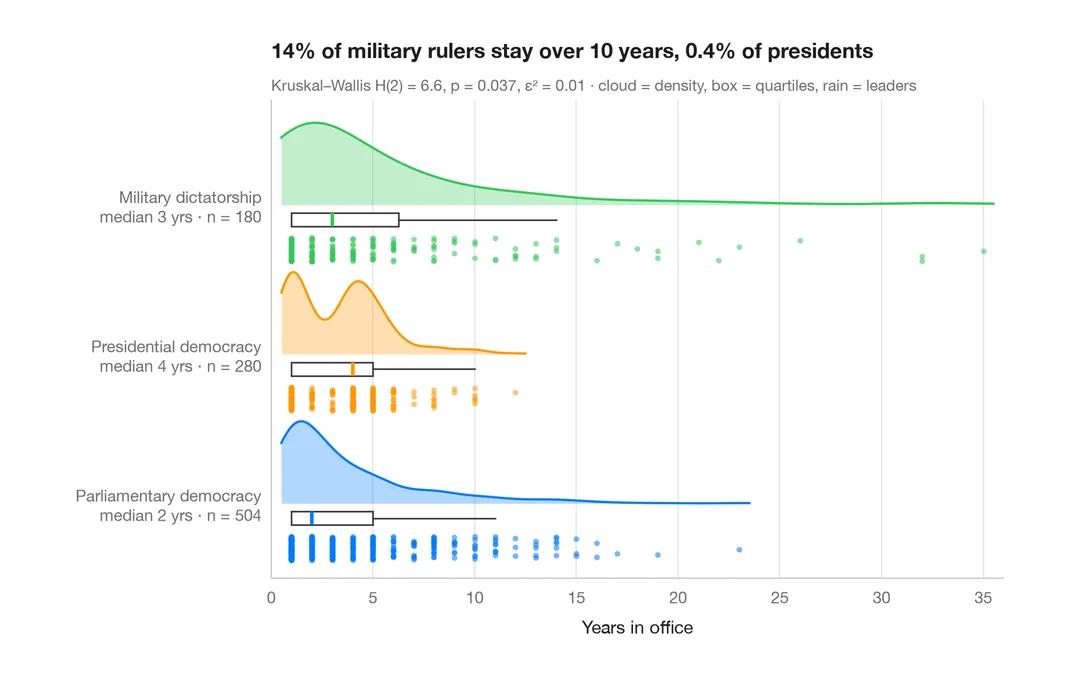
Distributions
Raincloud plot
Half violin, box plot and raw points per group, drawn horizontally.
ggdist::stat_halfeye() / ggrain::geom_rain()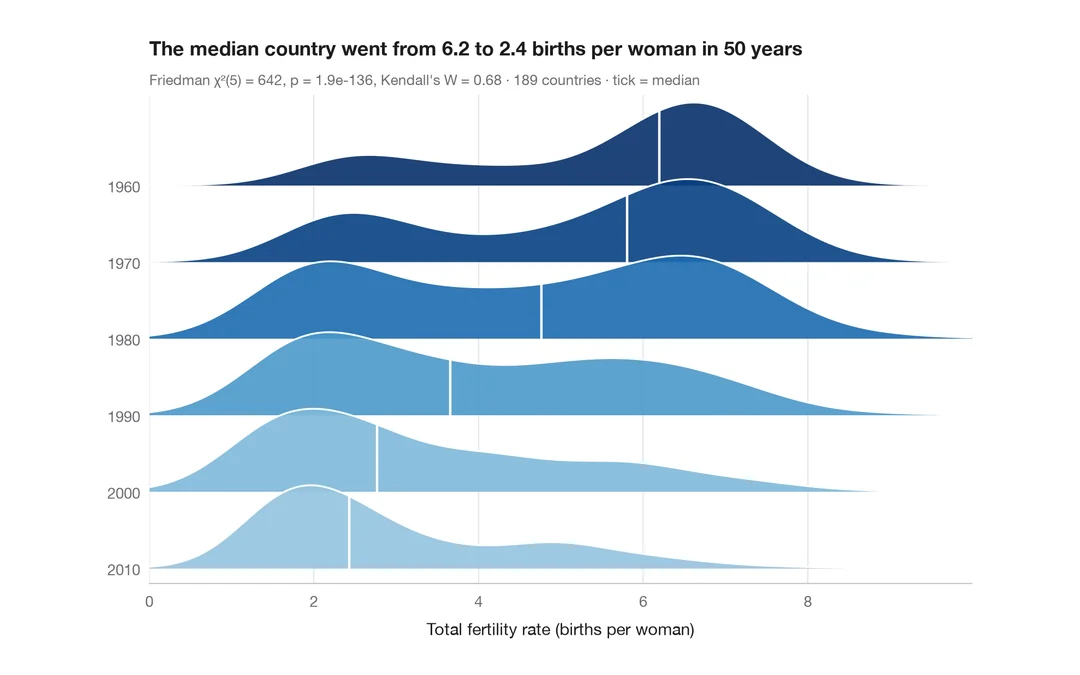
Distributions
Ridgeline plot
Overlapping density curves to compare one distribution across many groups.
ggridges::geom_density_ridges()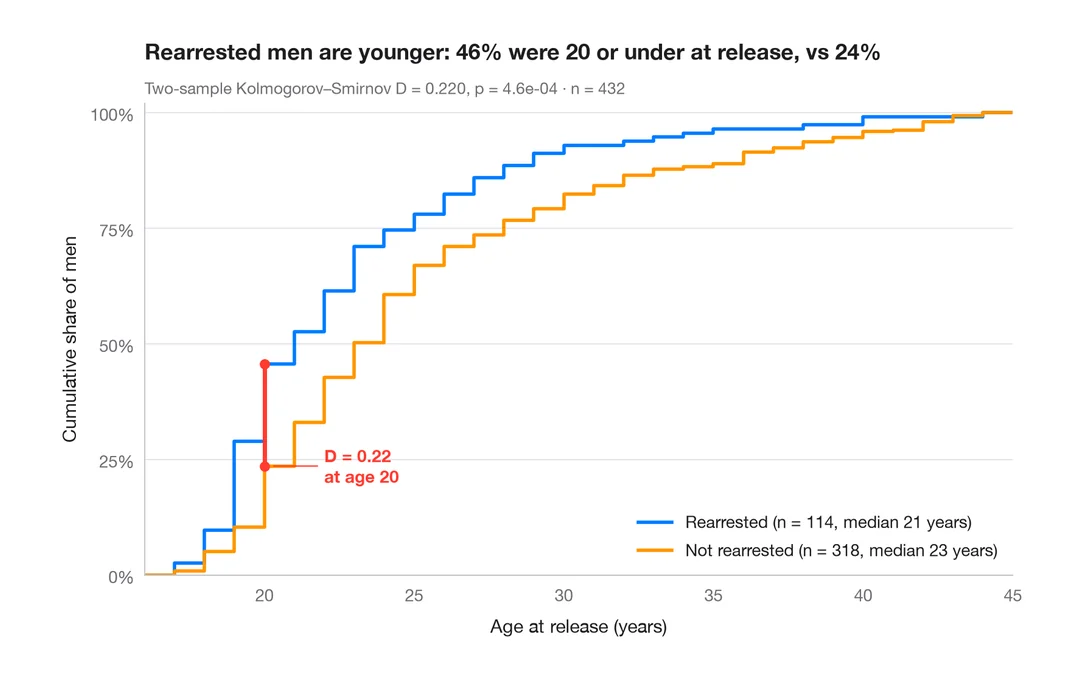
Distributions
ECDF comparison
Empirical cumulative distributions of two groups, with the Kolmogorov–Smirnov gap.
ggplot2::stat_ecdf()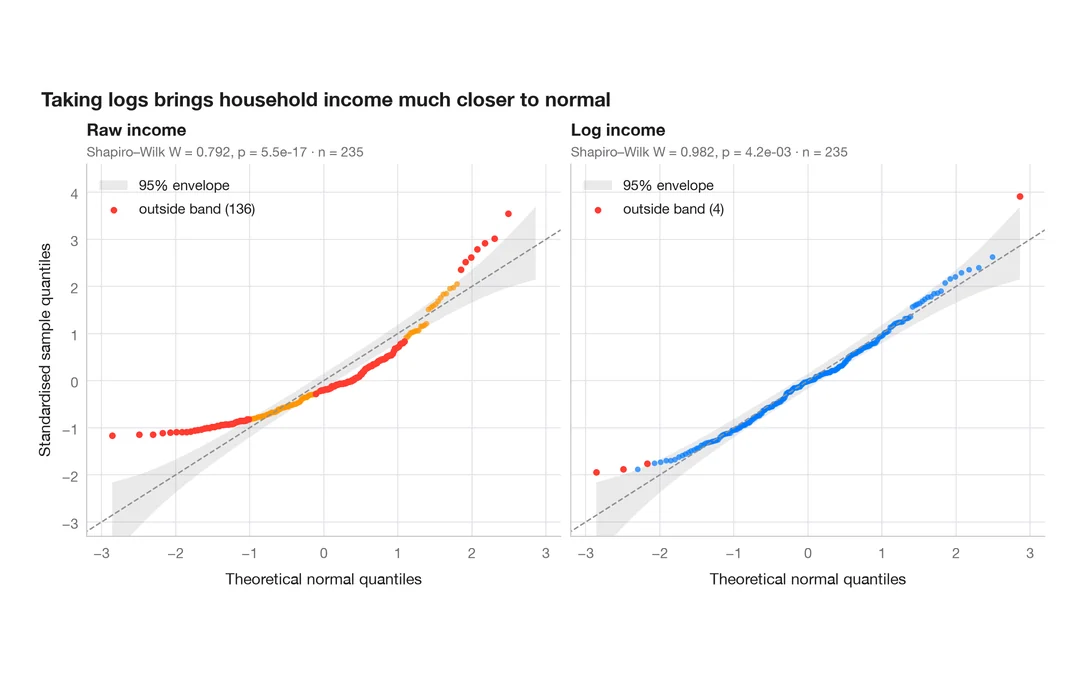
Distributions
Q–Q plot with confidence band
Normal quantile–quantile plots with a 95% envelope, for a raw and a logged variable.
qqplotr::stat_qq_band()