带聚类的相关图
13 个学区指标的 corrplot 风格圆圈图,圆圈大小和颜色由 r 决定,并按层次聚类排序。
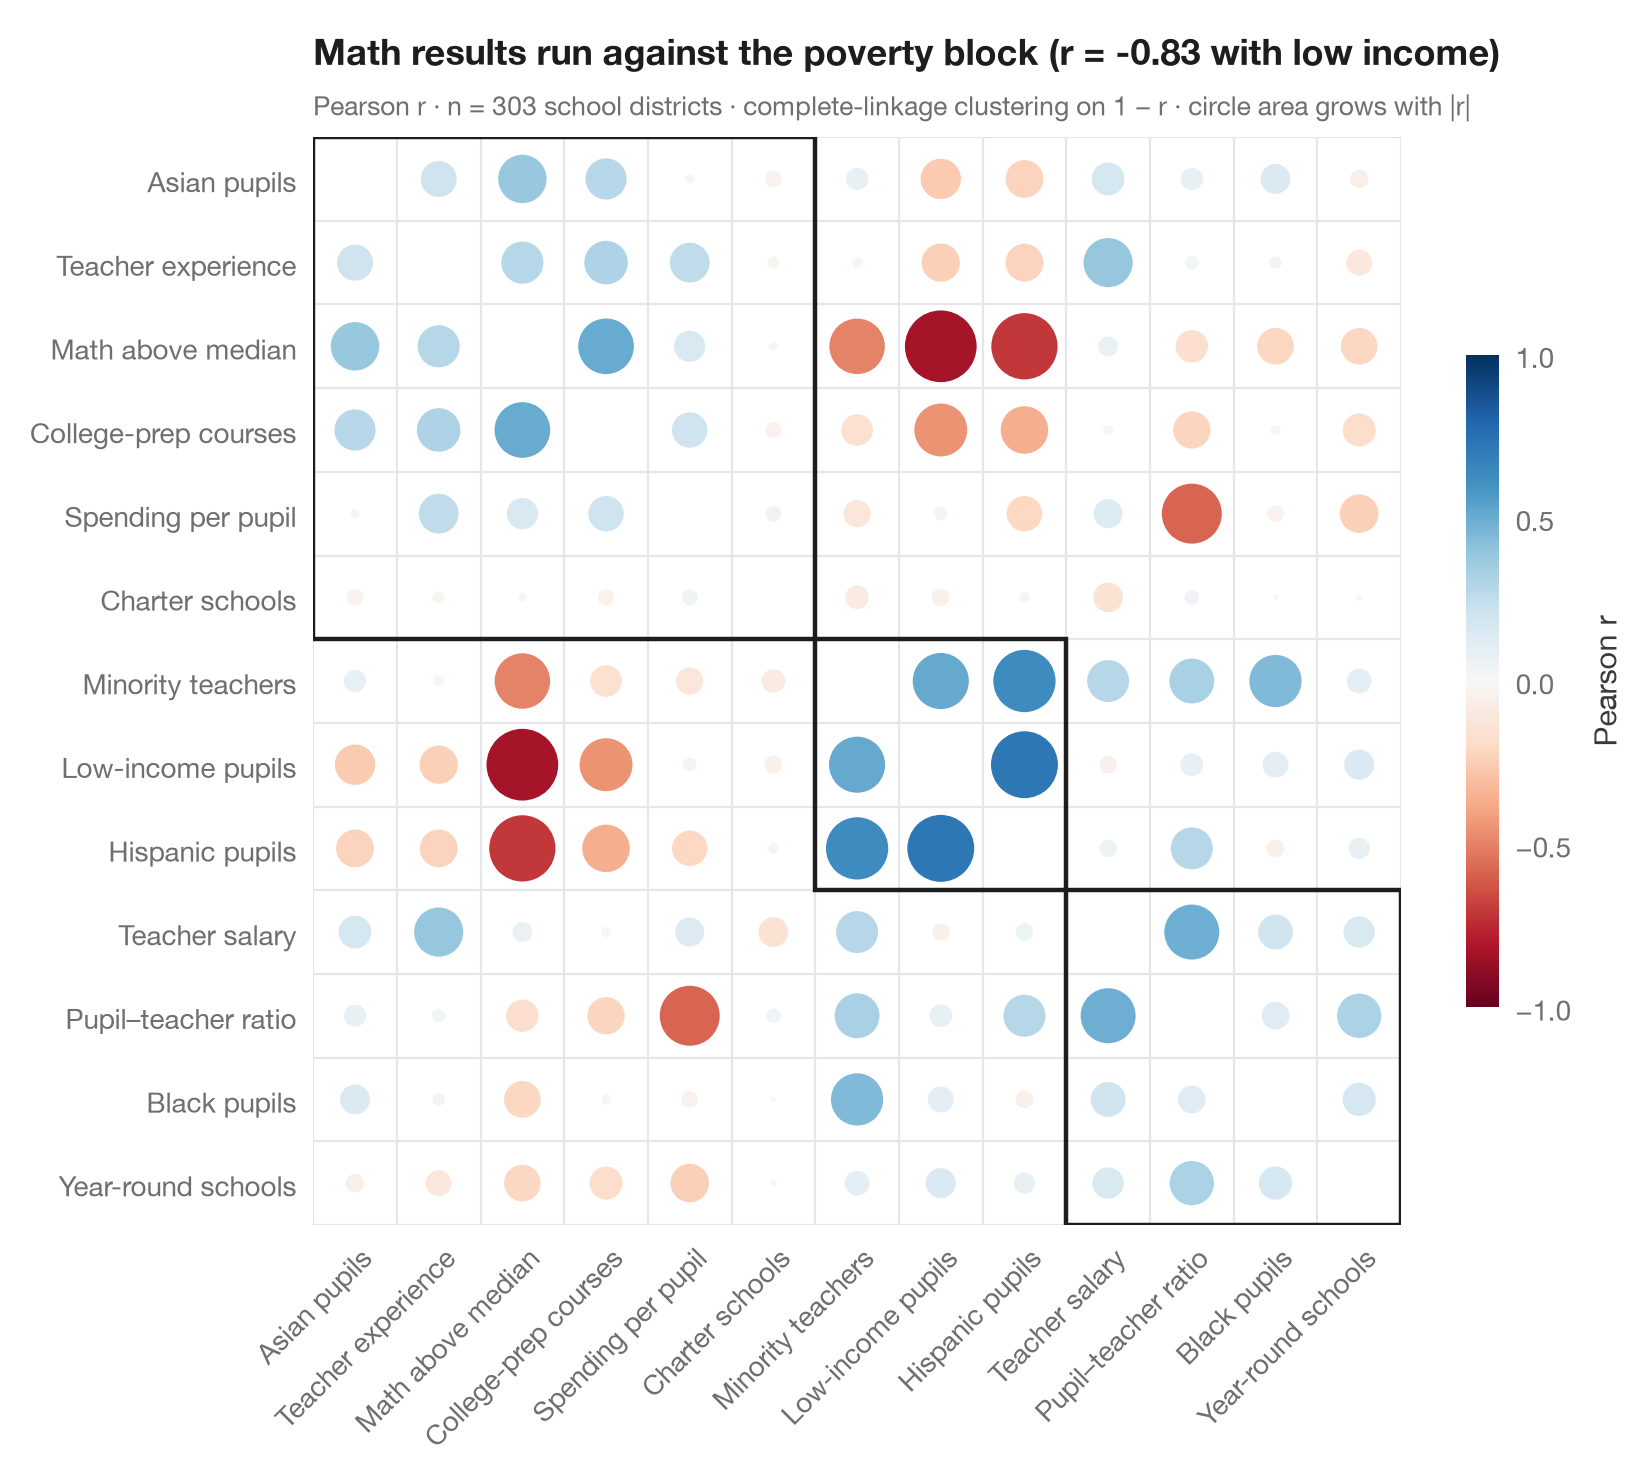
corrplot(method = "circle", order = "hclust") 的 Python 版本。每个圆圈的面积随 |r| 增大,颜色表示符号,因此强相关十分醒目,弱相关则逐渐淡去。变量按层次聚类(以 1 − r 为距离的完全连接法)重新排序,使正相关的变量沿对角线聚成块;方框勾勒出三个聚类,效果同 addrect = 3。在这里,低收入学生、西班牙裔学生和少数族裔教师构成一个块,而数学成绩与这三者均呈负相关。
数据为 statsmodels 自带的 STAR98 测试中加州 303 个学区(sm.datasets.star98)的 13 个指标:数学成绩(高于全国中位数的学生比例)、学生构成(低收入、西班牙裔、黑人和亚裔学生)、教师(少数族裔比例、从教年数、薪资)、资源(生均支出、生师比)以及学校组织(大学预备课程、特许学校和全年制学校)。排序来自 scipy.cluster.hierarchy.linkage 和 leaves_list,方框来自 fcluster。
代码及图中文字均为英文。
import matplotlib.pyplot as plt
import numpy as np
import statsmodels.api as sm
from matplotlib.patches import Circle, Rectangle
from scipy.cluster.hierarchy import fcluster, leaves_list, linkage
from scipy.spatial.distance import squareform

# Data: 13 indicators for 303 California school districts (STAR98, bundled with statsmodels)
df = sm.datasets.star98.load_pandas().data
df["MATH"] = 100 * df.NABOVE / (df.NABOVE + df.NBELOW)
labels = {"MATH": "Math above median", "LOWINC": "Low-income pupils",
          "PERHISP": "Hispanic pupils", "PERBLACK": "Black pupils",
          "PERASIAN": "Asian pupils", "PERMINTE": "Minority teachers",
          "AVYRSEXP": "Teacher experience", "AVSALK": "Teacher salary",
          "PERSPENK": "Spending per pupil", "PTRATIO": "Pupil–teacher ratio",
          "PCTAF": "College-prep courses", "PCTCHRT": "Charter schools",
          "PCTYRRND": "Year-round schools"}
df = df[list(labels)].rename(columns=labels)
corr = df.corr()

# Hierarchical clustering on the distance 1 - r, then reorder the matrix
Z = linkage(squareform(1 - corr.to_numpy(), checks=False), method="complete")
order = leaves_list(Z)
corr = corr.iloc[order, order]
clusters = fcluster(Z, t=3, criterion="maxclust")[order]
k = len(corr)

fig, ax = plt.subplots(figsize=(8.4, 7.2))
cmap, norm = plt.get_cmap("RdBu"), plt.Normalize(-1, 1)
for i in range(k):
    for j in range(k):
        r = corr.iat[i, j]
        if i == j:
            continue
        ax.add_patch(Circle((j, i), radius=0.47 * np.sqrt(abs(r)), color=cmap(norm(r)), lw=0))

# Boxes around the clusters (consecutive runs along the diagonal)
start = 0
for idx in range(1, k + 1):
    if idx == k or clusters[idx] != clusters[start]:
        ax.add_patch(Rectangle((start - 0.5, start - 0.5), idx - start, idx - start,
                               fill=False, ec="#1D1D1F", lw=1.6))
        start = idx

ax.set_xticks(range(k), corr.columns, rotation=45, ha="right", rotation_mode="anchor")
ax.set_yticks(range(k), corr.index)
ax.set_xticks(np.arange(-0.5, k), minor=True)
ax.set_yticks(np.arange(-0.5, k), minor=True)
ax.grid(which="minor", color="#E5E5EA", lw=0.8)
ax.grid(which="major", visible=False)
ax.tick_params(which="minor", length=0)
ax.set_xlim(-0.5, k - 0.5)
ax.set_ylim(k - 0.5, -0.5)
ax.set_aspect("equal")
for s in ax.spines.values():
    s.set_visible(False)

cb = fig.colorbar(plt.cm.ScalarMappable(norm=norm, cmap=cmap), ax=ax, shrink=0.6, pad=0.02,
                  ticks=[-1, -0.5, 0, 0.5, 1])
cb.set_label("Pearson r", color="#3A3A3C")
cb.outline.set_visible(False)
r_pov = corr.loc["Math above median", "Low-income pupils"]
ax.set_title(f"Math results run against the poverty block (r = {r_pov:.2f} with low income)", pad=26)
ax.text(0, 1.02, f"Pearson r · n = {len(df)} school districts · complete-linkage clustering on 1 − r · "
        "circle area grows with |r|", transform=ax.transAxes, fontsize=9.5, color="#6E6E73")
plt.show()
图表使用了可选的 PyStatlas 样式:添加 plt.style.use("pystatlas.mplstyle") 即可完全还原其外观。
数据来源
- California STAR test results, 1998 (303 school districts). Gill, J. (2001). Generalized Linear Models: A Unified Approach (Quantitative Applications in the Social Sciences, No. 134). Sage. https://www.statsmodels.org/stable/datasets/generated/star98.html
Original data from the California Department of Education's Standardized Testing and Reporting (STAR) program, 1998. Subset distributed with statsmodels (sm.datasets.star98) with the author's permission.
这些示例用于说明统计方法。图表标题描述的是该图在这些特定数据中呈现的内容——这些数据往往样本较小、年代较早或并不完整——而不是作者对实质问题的立场。关于解释、背景和数据质量,请以此处引用的原始来源为准。
如何引用
PyStatlas 由 Thierry Warin 创建并维护。如果它对你的工作有所帮助,敬请引用。
Warin, T. (2026). Correlogram with clustering. In PyStatlas: A Python Gallery of Statistical Graphics for the Social Sciences. https://warint.github.io/pystatlas/correlation/correlogram-bubble/
@misc{warin2026statlas,
  author       = {Warin, Thierry},
  title        = {PyStatlas: A Python Gallery of Statistical Graphics for the Social Sciences},
  year         = {2026},
  howpublished = {\url{https://warint.github.io/pystatlas/}},
  note         = {Source code: https://github.com/warint/pystatlas}
}