Adjusted survival curves
Cox model–predicted survival for several ages, other covariates held at their mean.
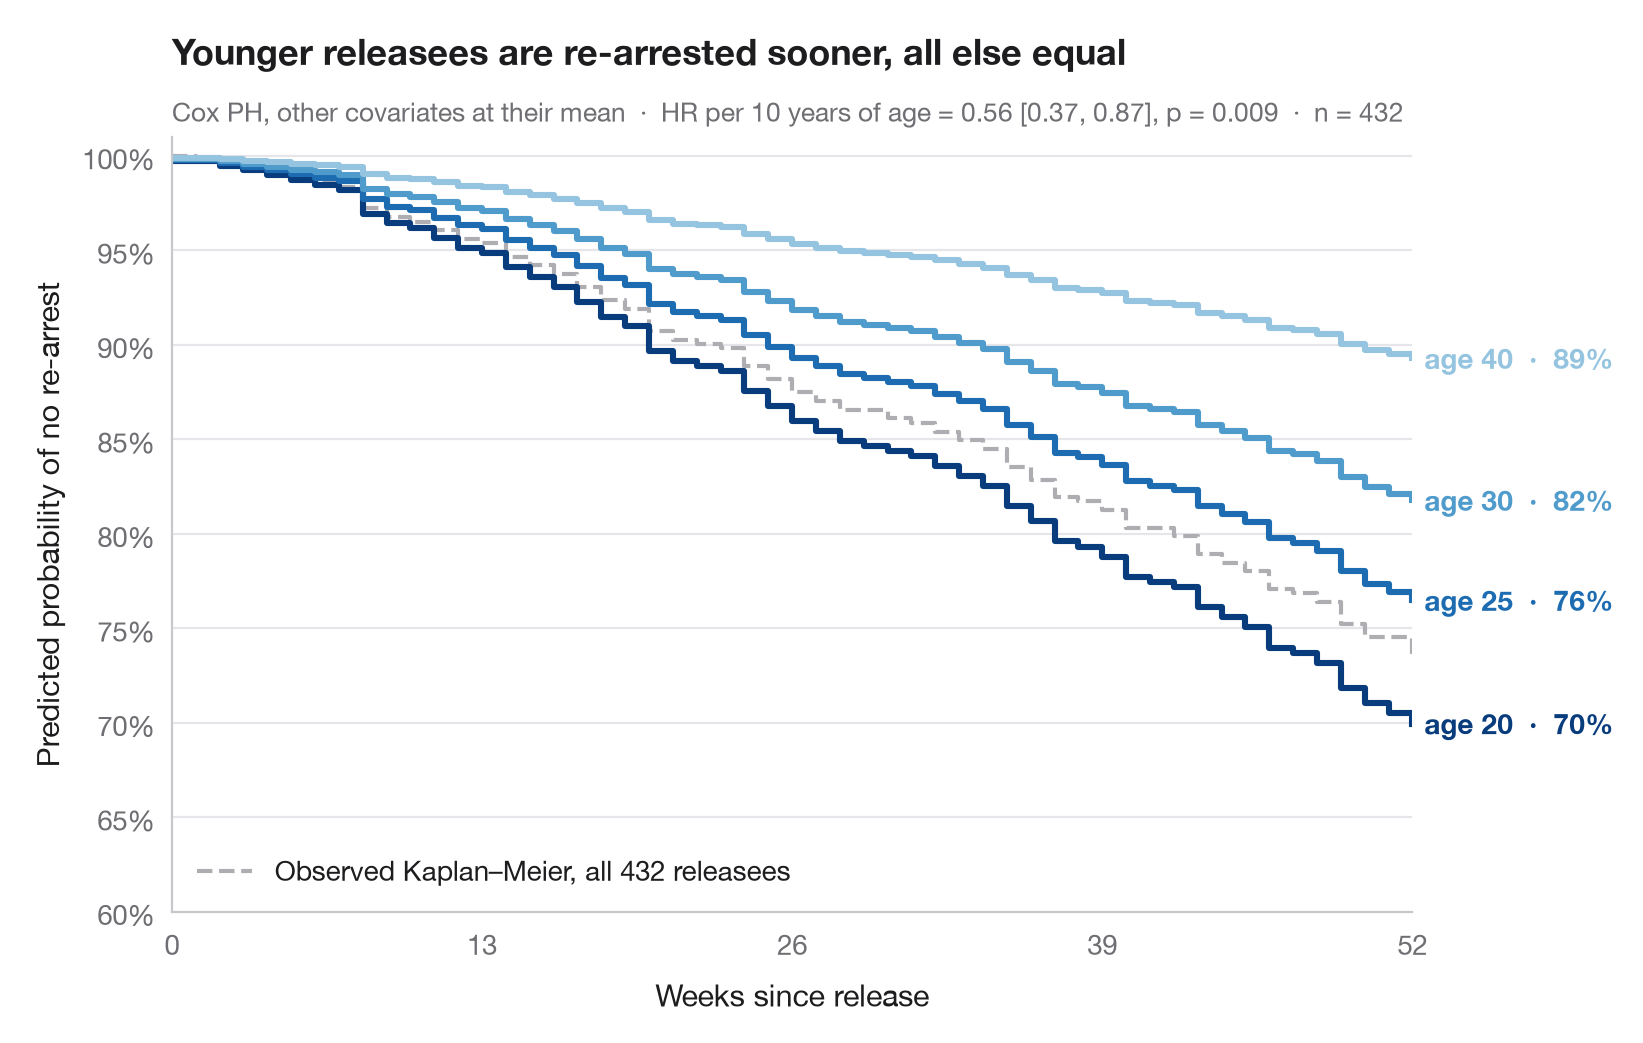
A hazard ratio is hard to feel; a survival curve is not. Here a fitted Cox proportional hazards model is used to predict the whole survival curve for hypothetical individuals who differ only in age, while every other covariate is fixed at its sample mean. The vertical spread between the curves is the effect of age translated into the probability of staying arrest-free.
Data are the Rossi recidivism study (lifelines.datasets.load_rossi). The model
is fitted with lifelines.CoxPHFitter on all seven covariates and the curves come
from predict_survival_function(); the observed Kaplan–Meier curve of the whole
sample is drawn in grey for reference.
import matplotlib.pyplot as plt
import numpy as np
import pandas as pd
from lifelines import CoxPHFitter, KaplanMeierFitter
from lifelines.datasets import load_rossi

# Data: weeks to re-arrest after release from prison
df = load_rossi()
cph = CoxPHFitter().fit(df, duration_col="week", event_col="arrest")

# Hypothetical profiles: everything at the mean, age varies
ages = [20, 25, 30, 40]
profiles = pd.DataFrame([df.drop(columns=["week", "arrest"]).mean()] * len(ages))
profiles["age"] = ages
surv = cph.predict_survival_function(profiles, times=np.arange(0, 53))
colors = plt.cm.Blues(np.linspace(0.95, 0.4, len(ages)))

fig, ax = plt.subplots(figsize=(8, 5))

# Observed Kaplan–Meier curve of the whole sample, for reference
km = KaplanMeierFitter().fit(df.week, df.arrest)
ax.step(km.survival_function_.index, km.survival_function_.iloc[:, 0], where="post",
        color="#AEAEB2", lw=1.5, ls="--", label=f"Observed Kaplan–Meier, all {len(df)} releasees")
ax.legend(loc="lower left")

# Model-predicted curves, labelled at their end
for col, age, c in zip(surv.columns, ages, colors):
    s = surv[col]
    ax.step(s.index, s, where="post", color=c, lw=2.2)
    ax.text(52.5, s.iloc[-1], f"age {age}  ·  {s.iloc[-1]:.0%}", va="center",
            fontsize=10, color=c, fontweight="semibold")

hr10 = np.exp(10 * cph.params_["age"])
lo, hi = np.exp(10 * cph.confidence_intervals_.loc["age"])
p = cph.summary.loc["age", "p"]
ax.set(xlim=(0, 52), ylim=(0.6, 1.01), xticks=range(0, 53, 13),
       xlabel="Weeks since release", ylabel="Predicted probability of no re-arrest")
ax.yaxis.set_major_formatter(plt.matplotlib.ticker.PercentFormatter(1, decimals=0))
ax.set_title("Younger releasees are re-arrested sooner, all else equal", pad=26)
ax.text(0, 1.02, f"Cox PH, other covariates at their mean  ·  HR per 10 years of age = "
        f"{hr10:.2f} [{lo:.2f}, {hi:.2f}], p = {p:.3f}  ·  n = {len(df)}",
        transform=ax.transAxes, fontsize=9.5, color="#6E6E73")
plt.show()
Figures use the optional PyStatlas style: add plt.style.use("pystatlas.mplstyle") to match the look exactly.
Data source
- Rossi recidivism experiment (432 released prisoners). Rossi, P. H., Berk, R. A., & Lenihan, K. J. (1980). Money, Work, and Crime: Some Experimental Results. Academic Press. https://lifelines.readthedocs.io/en/latest/lifelines.datasets.html
Men released from Maryland state prisons in the 1970s, half randomly assigned to financial aid. Distributed with lifelines (lifelines.datasets.load_rossi).
The examples illustrate statistical methods. Their titles describe what each figure shows in these particular data — often a small, dated or partial sample — not the author's position on the substantive question. For interpretation, context and data quality, rely on the original sources cited here.
How to cite
PyStatlas is created and maintained by Thierry Warin. If it helped your work, please cite it.
Warin, T. (2026). Adjusted survival curves. In PyStatlas: A Python Gallery of Statistical Graphics for the Social Sciences. https://warint.github.io/pystatlas/survival/adjusted-survival/
@misc{warin2026statlas,
  author       = {Warin, Thierry},
  title        = {PyStatlas: A Python Gallery of Statistical Graphics for the Social Sciences},
  year         = {2026},
  howpublished = {\url{https://warint.github.io/pystatlas/}},
  note         = {Source code: https://github.com/warint/pystatlas}
}More in Survival analysis
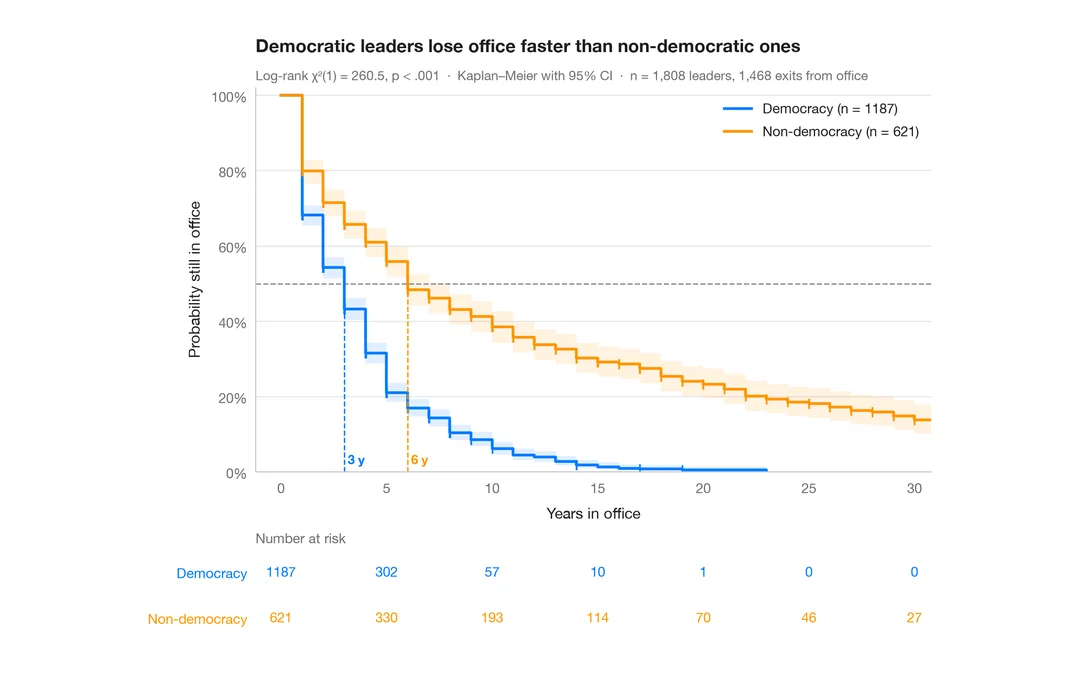
Kaplan–Meier curves
How long political leaders stay in office, democracies vs non-democracies — survival curves with confidence bands, censoring marks, log-rank test and risk table.
survminer::ggsurvplot(risk.table = TRUE)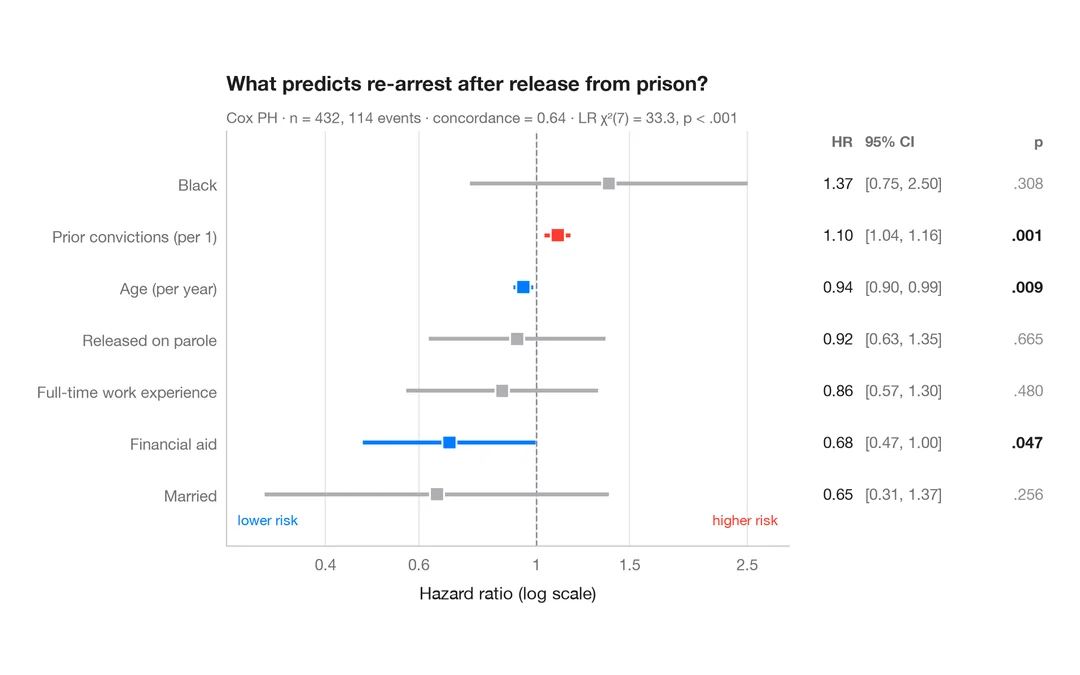
Cox hazard ratios
Forest plot of a Cox proportional hazards model with HR, 95% CI and p-values.
survminer::ggforest()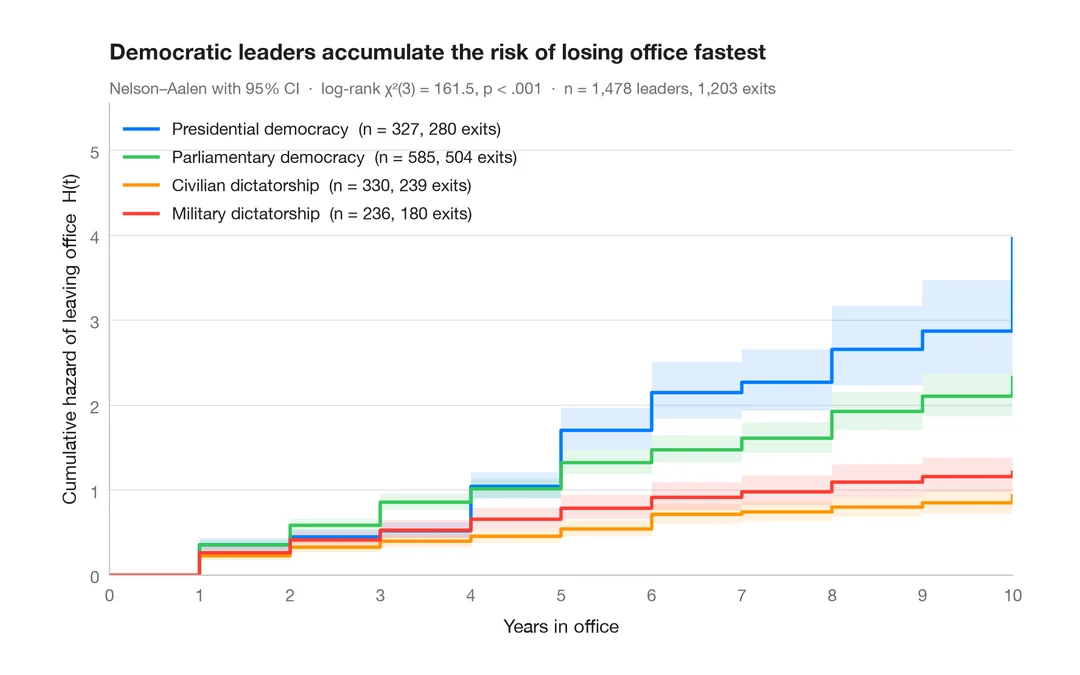
Cumulative hazard
Nelson–Aalen cumulative hazard of leaving office, with 95% bands, for four political regimes.
survminer::ggsurvplot(fun = "cumhaz")