Permutation importance
Which district characteristics a random forest relies on to predict maths results — drop in test-set R² when each one is shuffled.
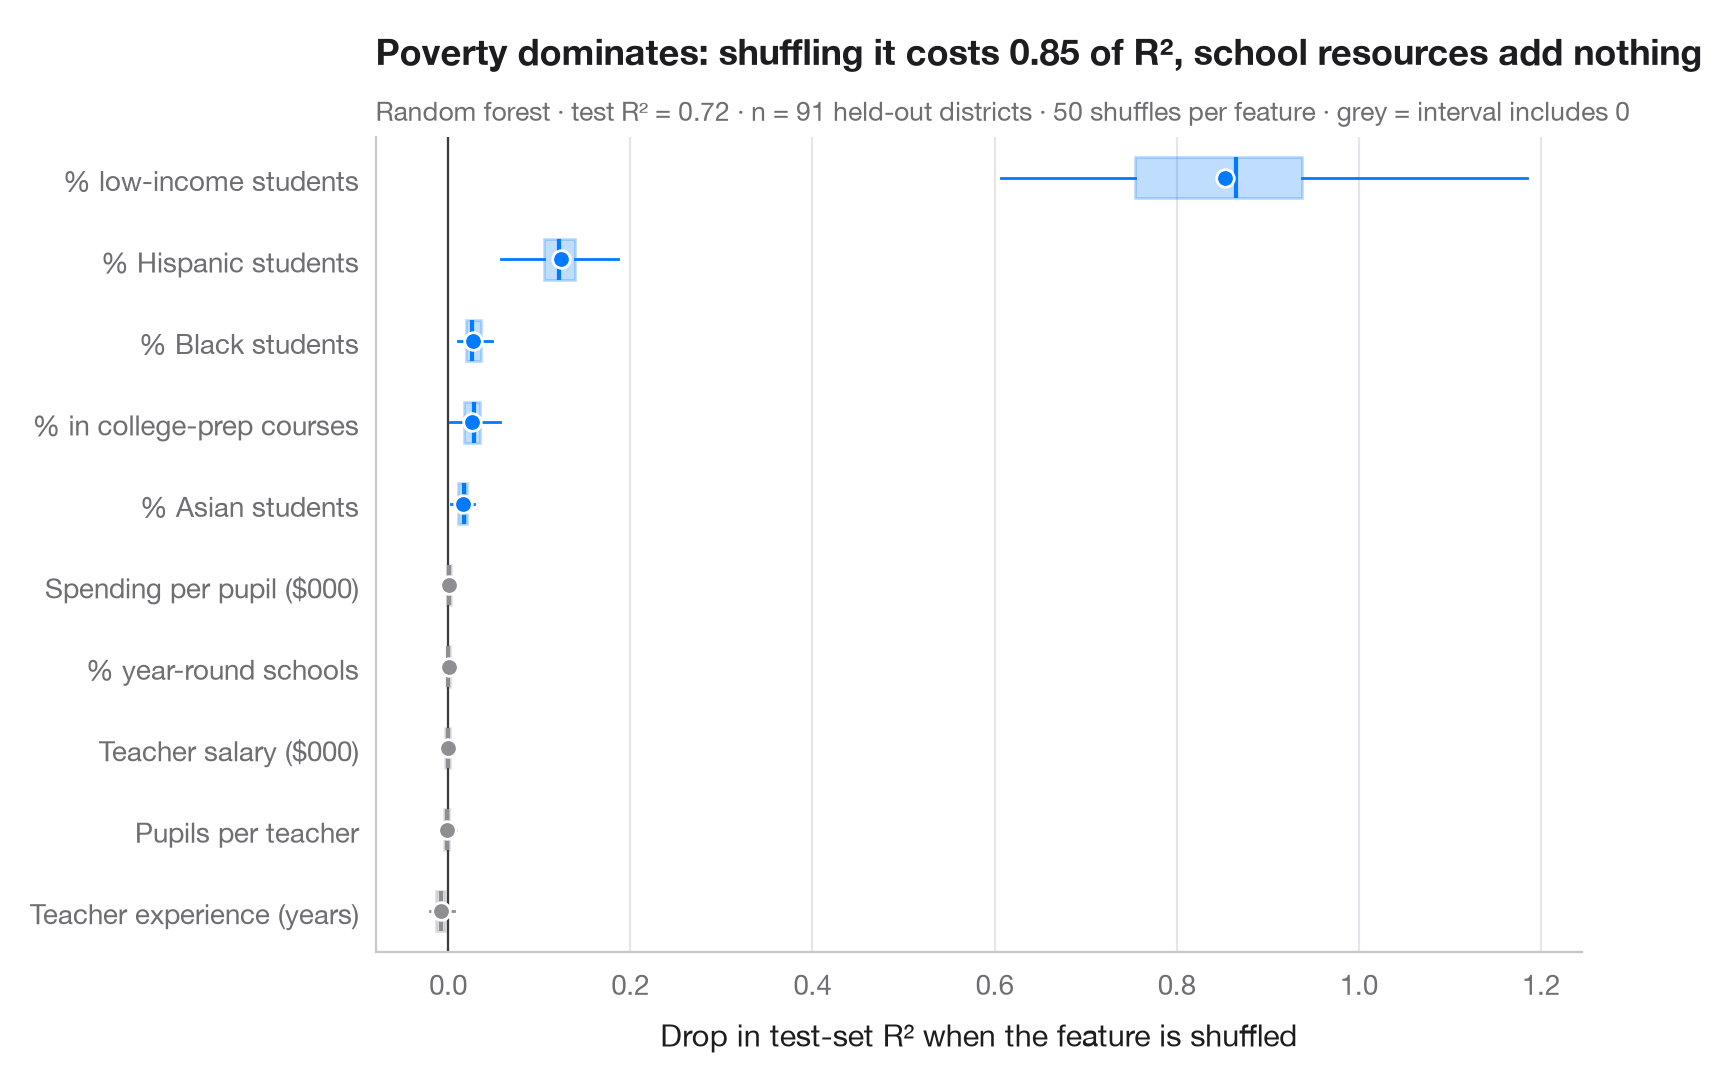
Permutation importance asks a simple, model-agnostic question: how much worse does the model predict on held-out data when one feature is shuffled, breaking its link with the outcome? A large drop means the model relies on that feature. Shuffling is random, so it is repeated 50 times per feature; the box shows the spread and the dot the mean. Features whose box straddles zero carry no usable signal for this model.
Unlike the impurity-based importances built into tree models, permutation
importance is computed on test data, is comparable across model types and is
not biased towards features with many distinct values. It measures what the
model uses, not causal effects, and correlated features share (and can
hide) each other's importance. Data are the 303 California school districts of
the 1998 STAR test bundled with statsmodels (sm.datasets.star98); the
outcome is the share of students scoring above the national median in maths,
predicted from ten district characteristics (poverty, ethnic composition,
teachers, spending, class size, college-prep enrolment). The model is a random
forest; importances come from sklearn.inspection.permutation_importance.
Here the share of low-income students dominates, while teacher pay, spending
and class size add nothing once it is known — a statement about the model's
predictions, not proof that resources do not matter.
import matplotlib.pyplot as plt
import numpy as np
import statsmodels.api as sm
from sklearn.ensemble import RandomForestRegressor
from sklearn.inspection import permutation_importance
from sklearn.model_selection import train_test_split

# Data: 303 California school districts; outcome = % of students above the national median in maths
d = sm.datasets.star98.load_pandas().data
y = 100 * d["NABOVE"] / (d["NABOVE"] + d["NBELOW"])
names = {"LOWINC": "% low-income students", "PERASIAN": "% Asian students", "PERBLACK": "% Black students",
         "PERHISP": "% Hispanic students", "AVYRSEXP": "Teacher experience (years)",
         "AVSALK": "Teacher salary ($000)", "PERSPENK": "Spending per pupil ($000)",
         "PTRATIO": "Pupils per teacher", "PCTAF": "% in college-prep courses",
         "PCTYRRND": "% year-round schools"}
X = d[list(names)]
X_tr, X_te, y_tr, y_te = train_test_split(X, y, test_size=0.3, random_state=0)

model = RandomForestRegressor(n_estimators=500, min_samples_leaf=3, random_state=0).fit(X_tr, y_tr)
r2 = model.score(X_te, y_te)
imp = permutation_importance(model, X_te, y_te, n_repeats=50, random_state=0, scoring="r2")

order = np.argsort(imp.importances_mean)
fig, ax = plt.subplots(figsize=(8, 5.2))
for i, j in enumerate(order):
    v = imp.importances[j]
    c = "#007AFF" if np.percentile(v, 2.5) > 0 else "#8E8E93"
    ax.boxplot(v, positions=[i], widths=0.5, vert=False, showfliers=False, patch_artist=True,
               boxprops=dict(facecolor=c, alpha=0.25, edgecolor=c), medianprops=dict(color=c, lw=1.5),
               whiskerprops=dict(color=c), capprops=dict(visible=False))
    ax.scatter(v.mean(), i, s=40, color=c, zorder=3, edgecolor="white", lw=1)
ax.axvline(0, color="#3A3A3C", lw=0.8)
ax.set_yticks(range(len(order)), [names[X.columns[j]] for j in order])
ax.set_xlabel("Drop in test-set R² when the feature is shuffled")
ax.grid(axis="x"); ax.grid(axis="y", visible=False)
drop = imp.importances_mean[list(X.columns).index("LOWINC")]
ax.set_title(f"Poverty dominates: shuffling it costs {drop:.2f} of R², school resources add nothing", pad=26)
ax.text(0, 1.02, f"Random forest · test R² = {r2:.2f} · n = {len(X_te)} held-out districts · "
        "50 shuffles per feature · grey = interval includes 0", transform=ax.transAxes,
        fontsize=9.5, color="#6E6E73")
plt.show()
Figures use the optional PyStatlas style: add plt.style.use("pystatlas.mplstyle") to match the look exactly.
Data source
- California STAR test results, 1998 (303 school districts). Gill, J. (2001). Generalized Linear Models: A Unified Approach (Quantitative Applications in the Social Sciences, No. 134). Sage. https://www.statsmodels.org/stable/datasets/generated/star98.html
Original data from the California Department of Education's Standardized Testing and Reporting (STAR) program, 1998. Subset distributed with statsmodels (sm.datasets.star98) with the author's permission.
The examples illustrate statistical methods. Their titles describe what each figure shows in these particular data — often a small, dated or partial sample — not the author's position on the substantive question. For interpretation, context and data quality, rely on the original sources cited here.
How to cite
PyStatlas is created and maintained by Thierry Warin. If it helped your work, please cite it.
Warin, T. (2026). Permutation importance. In PyStatlas: A Python Gallery of Statistical Graphics for the Social Sciences. https://warint.github.io/pystatlas/machine-learning/permutation-importance/
@misc{warin2026statlas,
  author       = {Warin, Thierry},
  title        = {PyStatlas: A Python Gallery of Statistical Graphics for the Social Sciences},
  year         = {2026},
  howpublished = {\url{https://warint.github.io/pystatlas/}},
  note         = {Source code: https://github.com/warint/pystatlas}
}More in Machine learning
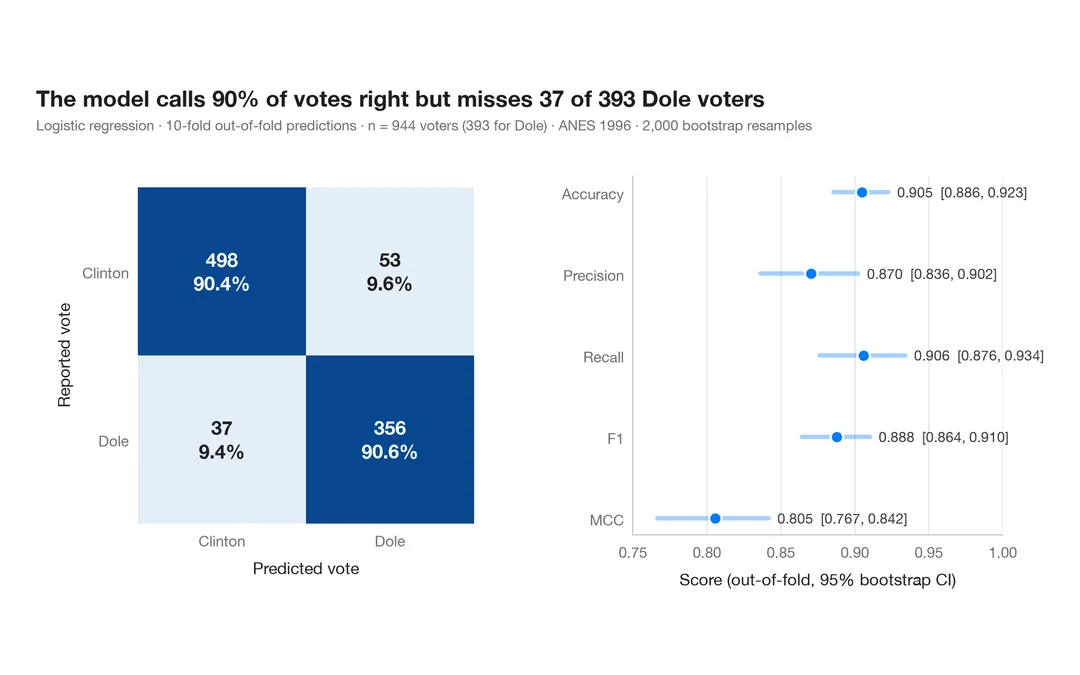
Confusion matrix with metrics
How well a logistic regression predicts who voted Dole in 1996 — out-of-fold confusion matrix with counts and row shares, and bootstrap intervals for the headline metrics.
yardstick::conf_mat() + autoplot()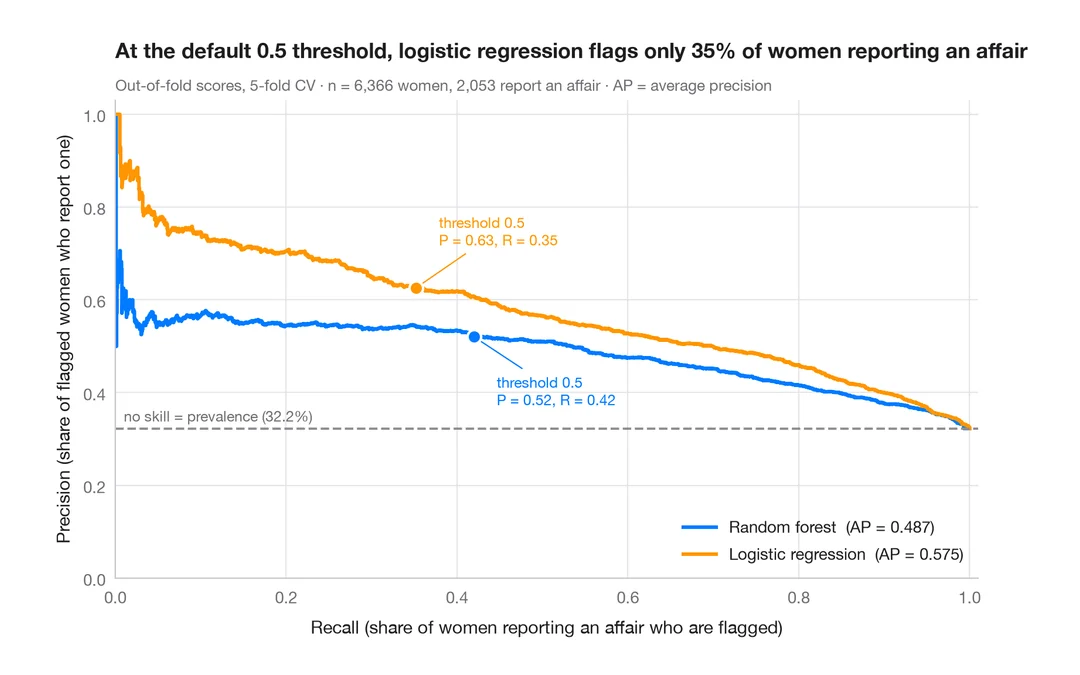
Precision–recall curves
Out-of-fold precision–recall curves for two classifiers predicting which married women report an affair, with average precision and the no-skill baseline.
yardstick::pr_curve() + autoplot()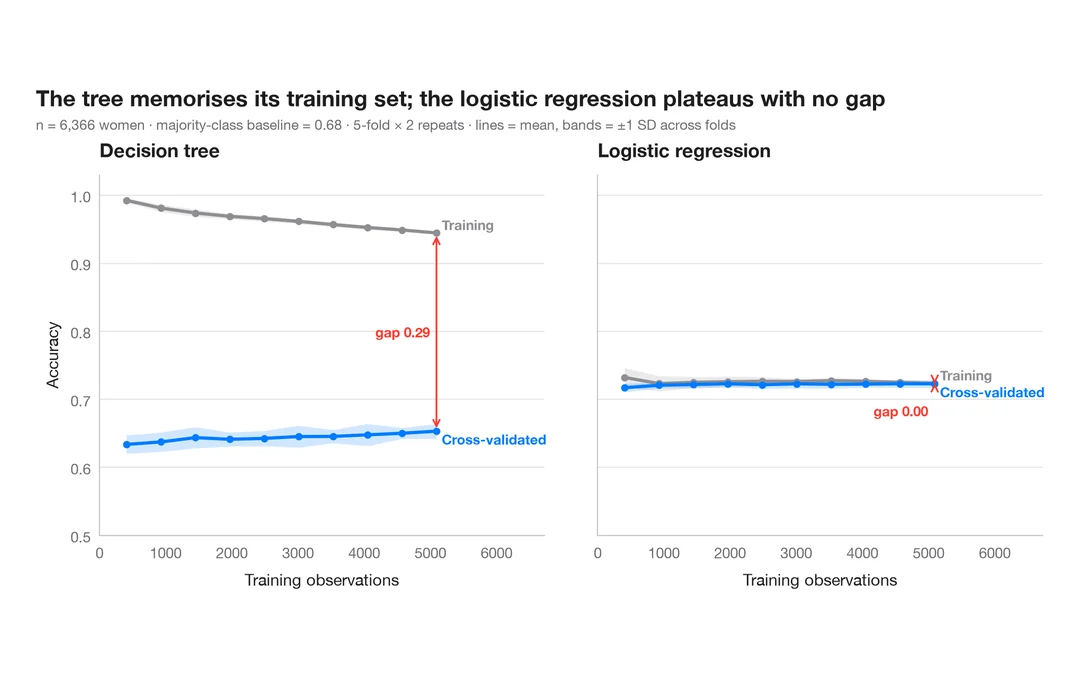
Learning curve
Training and cross-validated accuracy as the training set grows, for two models predicting which married women report an affair.
caret::learning_curve_dat() + ggplot()