交互作用プロット
2要因の群平均を 95% 信頼区間とともに描き、二元配置分散分析を添えます。
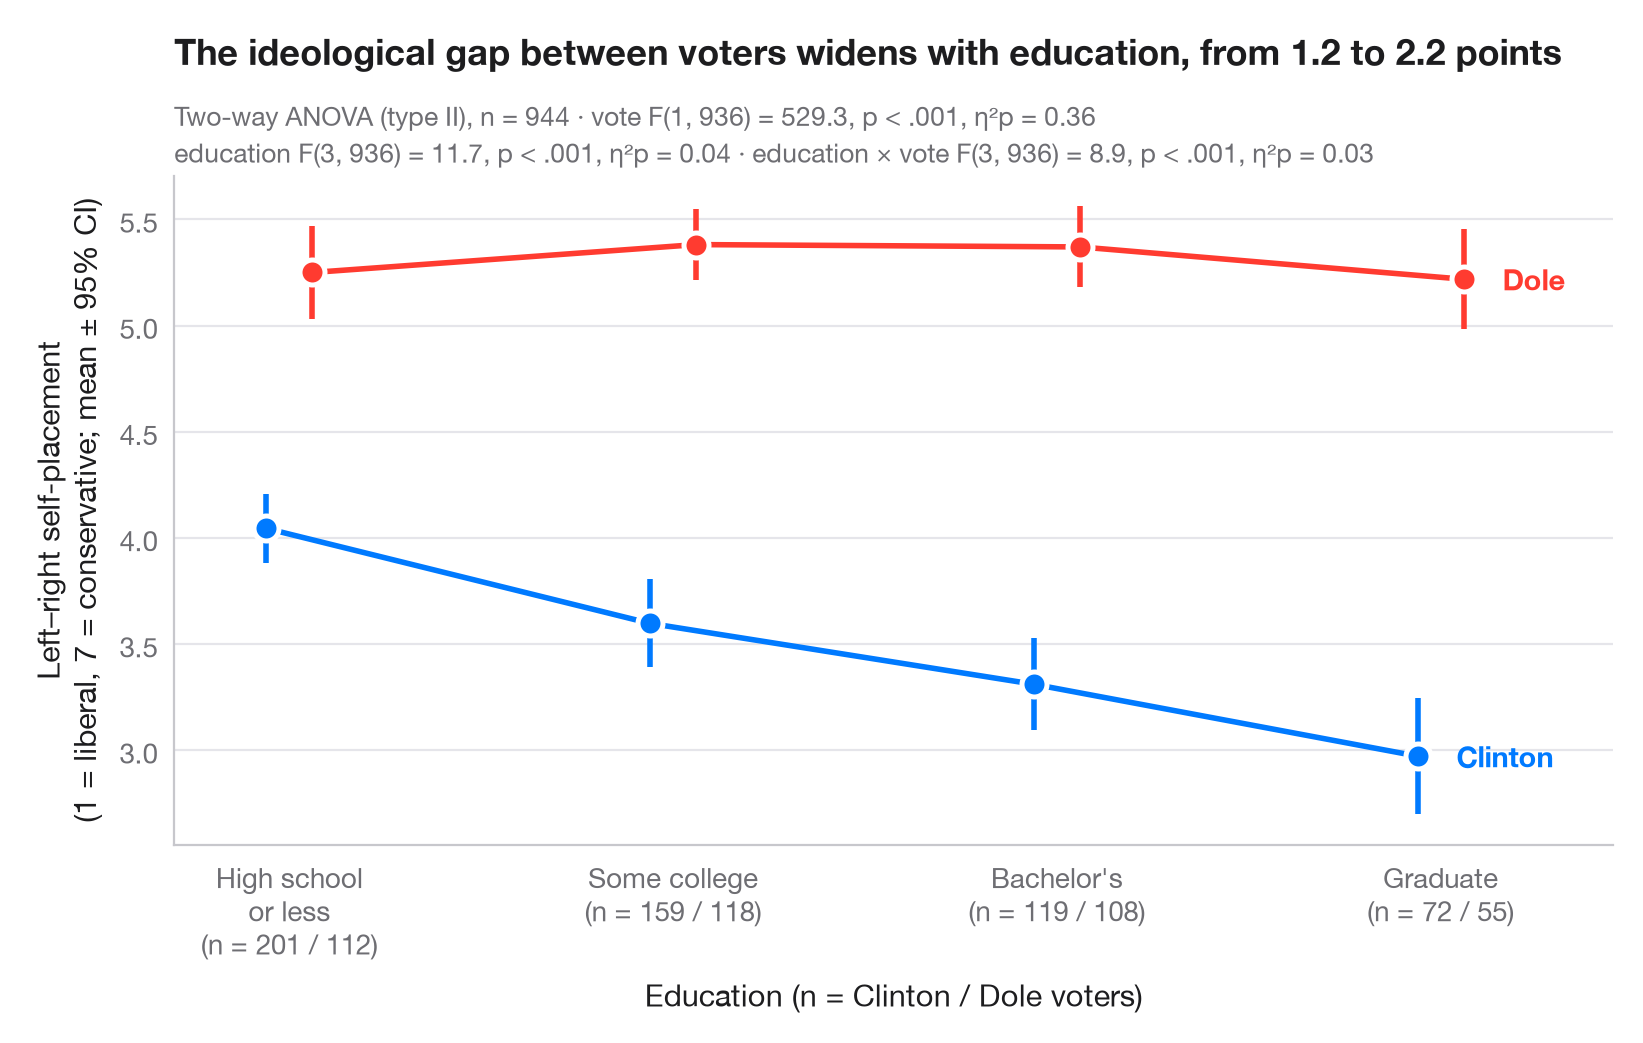
交互作用プロットは、2つの要因のすべての組み合わせについてアウトカムの平均を示します。一方の要因をx軸に、もう一方を少しずらした色付きの線で表し、各平均には 95% 信頼区間を付けています。線が平行なら2つの要因は独立に作用しており、線が収束・発散・交差する場合は交互作用があることを示します。
データは statsmodels に同梱されている1996年アメリカ全国選挙調査の有権者944人です(sm.datasets.anes96)。7段階のリベラル–保守尺度(1=きわめてリベラル、7=きわめて保守的)における自己位置づけを、学歴(調査の7つのコードを4段階にまとめたもの)と大統領選での投票先(クリントンまたはドール)別に示しています。二元配置分散分析(タイプ II 平方和)は statsmodels.formula.api.ols と statsmodels.stats.anova.anova_lm で求め、各項に偏 η² を添えています。信頼区間は t 分布にもとづいています。
コードおよび図中のテキストは英語です。
import matplotlib.pyplot as plt
import numpy as np
import pandas as pd
import statsmodels.api as sm
import statsmodels.formula.api as smf
from scipy import stats
from statsmodels.stats.anova import anova_lm

# Data: left–right self-placement (1–7) by education level and presidential vote
df = sm.datasets.anes96.load_pandas().data
classes = ["High school\nor less", "Some college", "Bachelor's", "Graduate"]
df["educ_level"] = pd.cut(df.educ, [0, 3, 5, 6, 7], labels=classes)  # survey codes 1–3, 4–5, 6, 7
df["voter"] = df.vote.map({0: "Clinton", 1: "Dole"})

# Two-way ANOVA with interaction (type II) + partial eta squared
aov = anova_lm(smf.ols("selfLR ~ C(educ_level) * C(voter)", data=df).fit(), typ=2)
ss_res = aov.loc["Residual", "sum_sq"]
aov["eta_p"] = aov.sum_sq / (aov.sum_sq + ss_res)
df_res = int(aov.loc["Residual", "df"])

# Means and t-based 95% CIs per cell
cells = df.groupby(["voter", "educ_level"], observed=True).selfLR.agg(["mean", "sem", "count"])
cells["half"] = cells["sem"] * stats.t.ppf(0.975, cells["count"] - 1)

fig, ax = plt.subplots(figsize=(8, 5))
x = np.arange(len(classes))
for (voter, c, dx) in [("Clinton", "#007AFF", -0.06), ("Dole", "#FF3B30", 0.06)]:
    m = cells.loc[voter].reindex(classes)
    ax.errorbar(x + dx, m["mean"], yerr=m["half"], color=c, lw=2, capsize=0,
                elinewidth=2, marker="o", ms=9, mec="white", mew=1.8, label=voter)
    ax.annotate(voter, (x[-1] + dx, m["mean"].iloc[-1]), xytext=(14, 0),
                textcoords="offset points", va="center", fontsize=10.5,
                fontweight="semibold", color=c)

# Cell sizes under the axis labels
n = cells["count"].unstack(0).reindex(classes)
ax.set_xticks(x, [f"{k}\n(n = {n.loc[k, 'Clinton']} / {n.loc[k, 'Dole']})" for k in classes])
ax.set_xlim(-0.3, len(classes) - 0.55)
ax.set_xlabel("Education (n = Clinton / Dole voters)")
ax.set_ylabel("Left–right self-placement\n(1 = liberal, 7 = conservative; mean ± 95% CI)")

# One "F(df1, df2) = …, p …, η²p = …" string per ANOVA term
stat = {}
for term, label in [("C(educ_level)", "education"), ("C(voter)", "vote"), ("C(educ_level):C(voter)", "education × vote")]:
    r = aov.loc[term]
    pval = "< .001" if r["PR(>F)"] < .001 else f"= {r['PR(>F)']:.2f}"
    stat[label] = f"{label} F({r.df:.0f}, {df_res}) = {r.F:.1f}, p {pval}, η²p = {r.eta_p:.2f}"

gap = cells.loc["Dole", "mean"] - cells.loc["Clinton", "mean"]
ax.set_title(f"The ideological gap between voters widens with education, "
             f"from {gap.iloc[0]:.1f} to {gap.iloc[-1]:.1f} points", pad=40)
ax.text(0, 1.075, f"Two-way ANOVA (type II), n = {len(df)} · {stat['vote']}",
        transform=ax.transAxes, fontsize=9.5, color="#6E6E73")
ax.text(0, 1.02, f"{stat['education']} · {stat['education × vote']}", transform=ax.transAxes,
        fontsize=9.5, color="#6E6E73")
plt.show()
図にはオプションの PyStatlas スタイル を使用しています。同じ見た目にするには plt.style.use("pystatlas.mplstyle") を追加してください。
データの出典
- American National Election Study, 1996. Rosenstone, S. J., Kinder, D. R., Miller, W. E., & the National Election Studies. (2016). ANES 1996 Time Series Study (ICPSR 6896; Version 6) [Data set]. Inter-university Consortium for Political and Social Research. https://doi.org/10.3886/ICPSR06896.v6
Subset of 944 respondents distributed with statsmodels (sm.datasets.anes96); public domain.
これらの例は統計手法を説明するためのものです。図のタイトルは、この特定のデータ(多くは小規模で、古く、部分的な標本)で図が示す内容を述べたものであり、実質的な問いに対する著者の立場ではありません。解釈、背景、データの質については、ここに挙げた元の出典を参照してください。
引用方法
PyStatlas は Thierry Warin が作成・運営しています。研究や業務に役立った場合は、ぜひ引用してください。
Warin, T. (2026). Interaction plot. In PyStatlas: A Python Gallery of Statistical Graphics for the Social Sciences. https://warint.github.io/pystatlas/group-comparisons/means-with-ci/
@misc{warin2026statlas,
  author       = {Warin, Thierry},
  title        = {PyStatlas: A Python Gallery of Statistical Graphics for the Social Sciences},
  year         = {2026},
  howpublished = {\url{https://warint.github.io/pystatlas/}},
  note         = {Source code: https://github.com/warint/pystatlas}
}