Gallery/Group comparisons
Group comparisons
Compare groups with the test, effect size and p-values on the chart — the ggstatsplot way.
Group comparisons
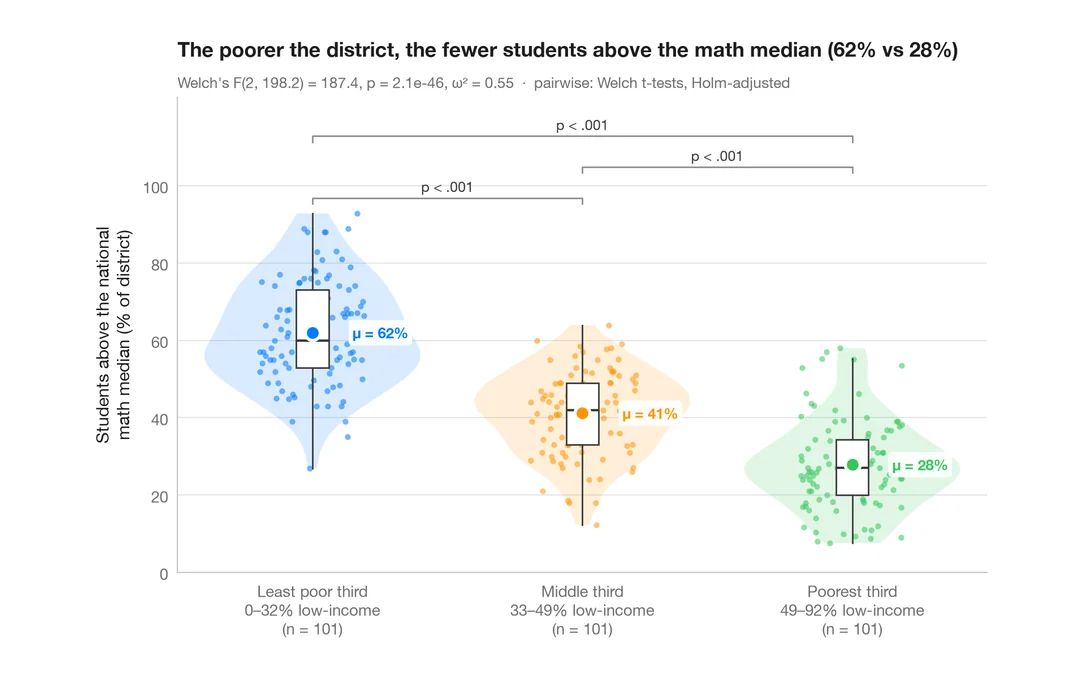
Between-groups comparison
Violin + box + points with Welch's ANOVA, effect size and pairwise tests.
ggstatsplot::ggbetweenstats()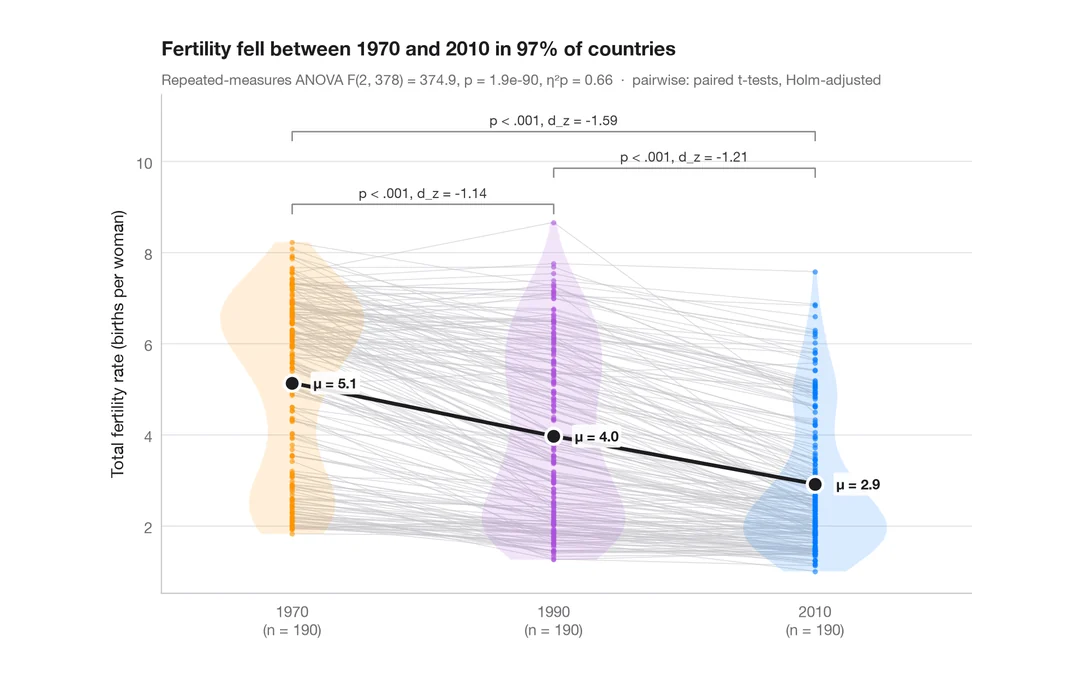
Group comparisons
Within-subjects comparison
Repeated measures with one line per subject, means, rm-ANOVA and paired tests.
ggstatsplot::ggwithinstats()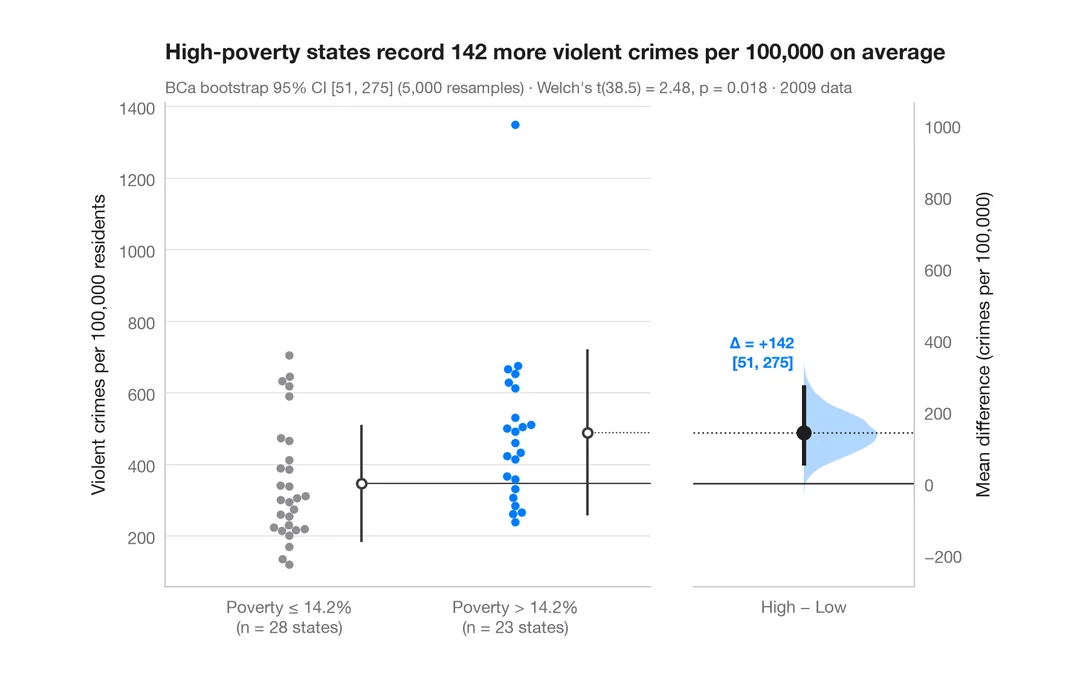
Group comparisons
Estimation plot
Raw data of two groups plus the mean difference and its bootstrap 95% CI.
dabestr::dabest() + plot()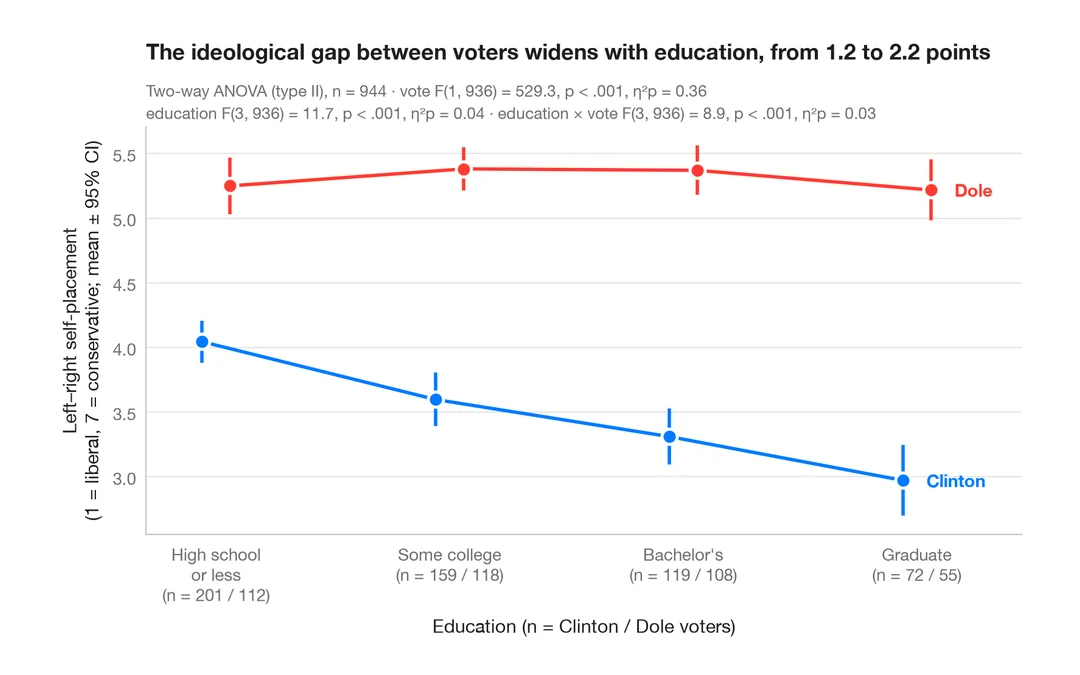
Group comparisons
Interaction plot
Group means with 95% confidence intervals for two factors, with a two-way ANOVA.
ggpubr::ggline(add = "mean_ci") / ggstats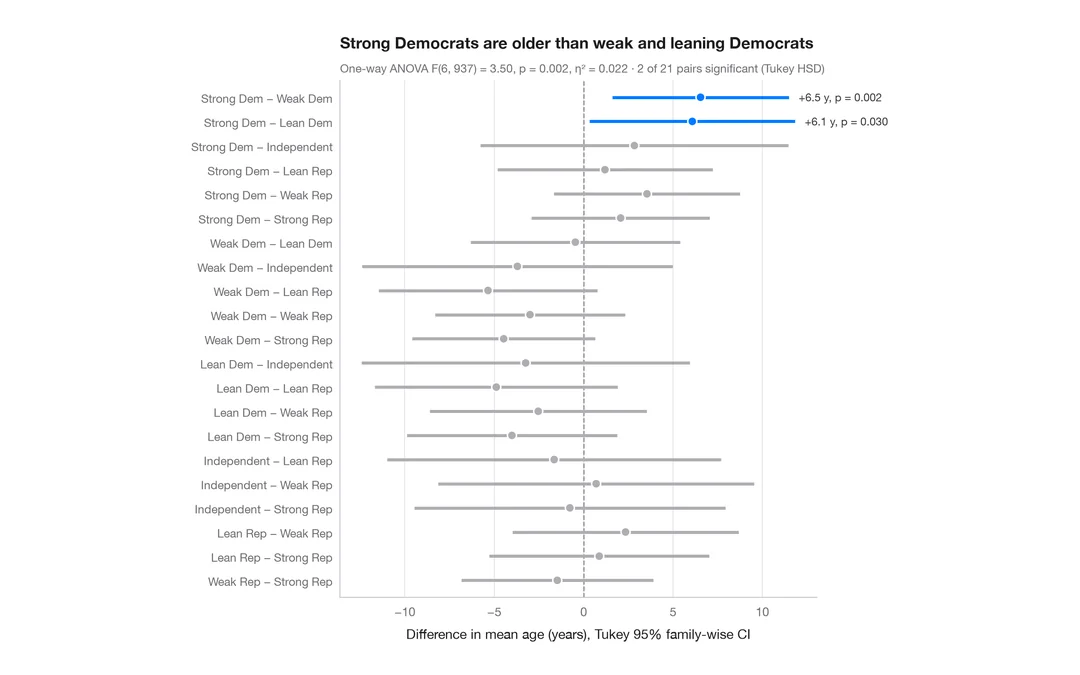
Group comparisons
Tukey HSD intervals
Simultaneous 95% confidence intervals for every pairwise difference in means.
TukeyHSD() + plot()