Correlation matrix
Lower-triangle Pearson correlation heatmap; non-significant cells (Holm) are crossed out.
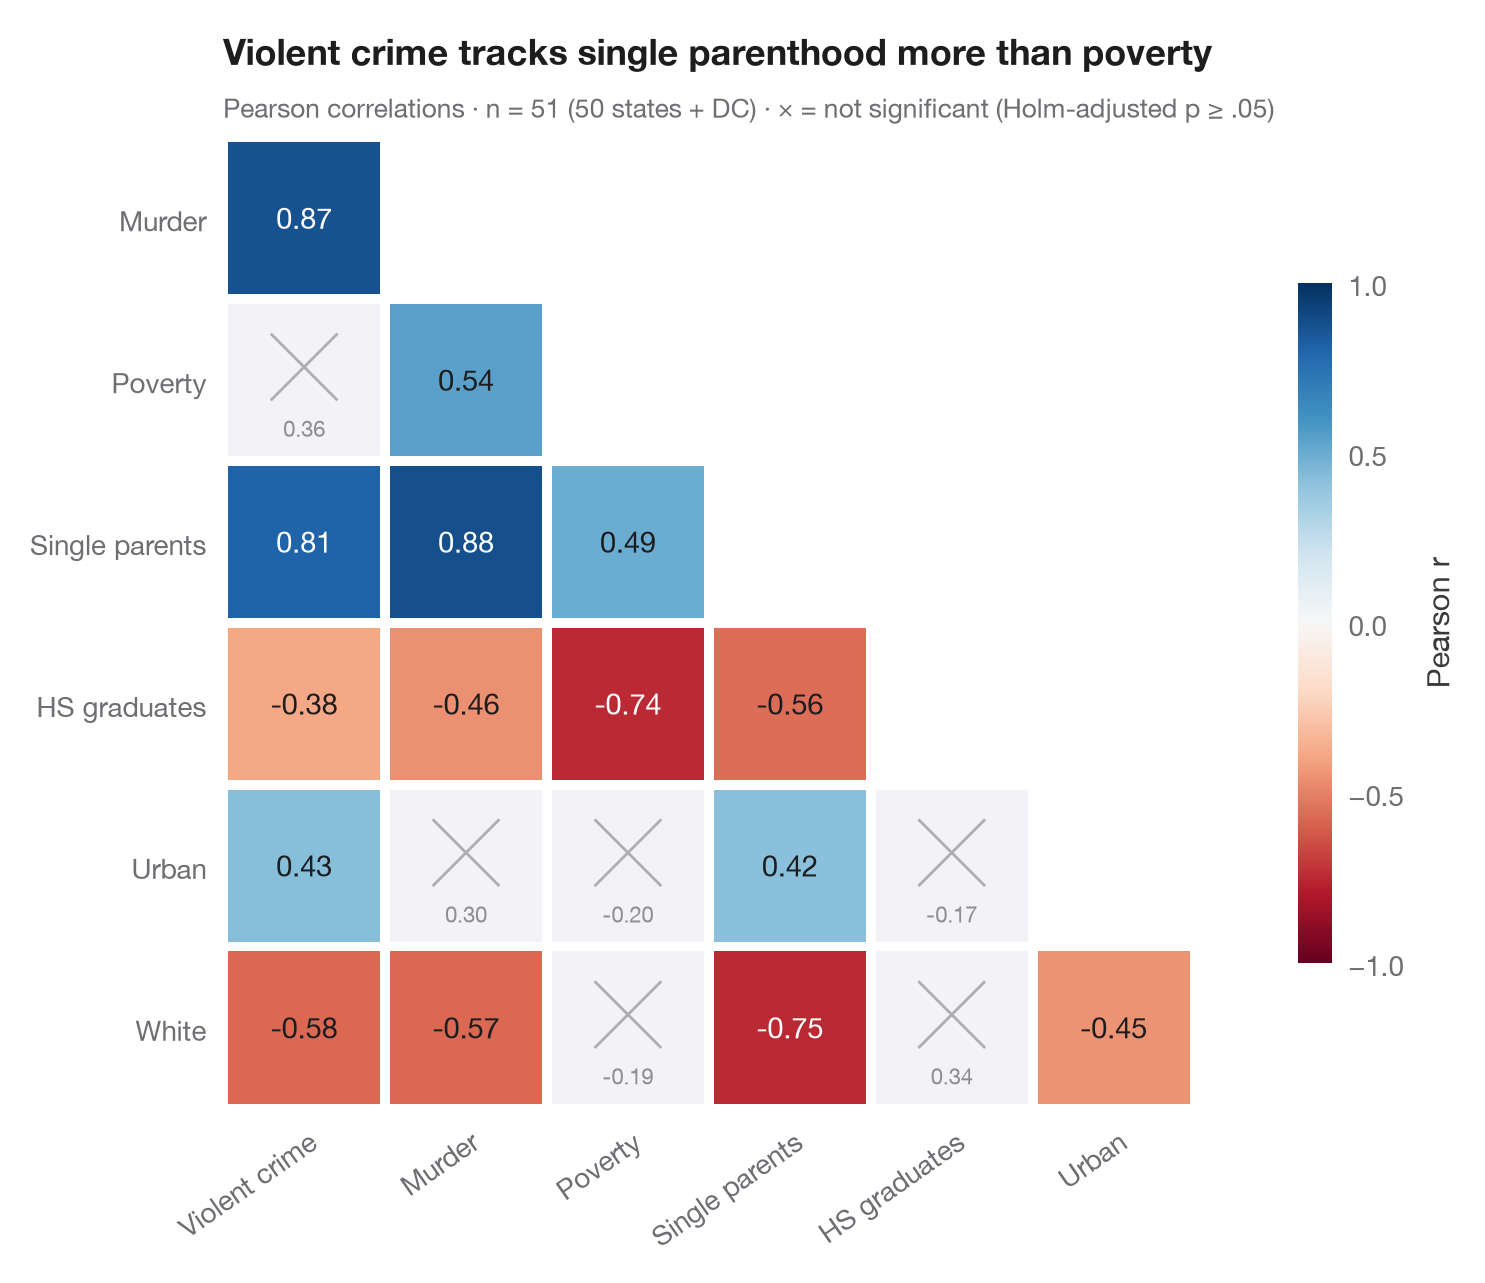
The Python counterpart of ggcorrmat(). Only the lower triangle is drawn, since
a correlation matrix is symmetric; each tile shows Pearson's r, coloured on a
diverging scale from −1 (red) to +1 (blue). Because 21 correlations are tested
at once, the p-values are Holm-adjusted, and pairs that are not significant
at α = .05 after adjustment are greyed out and crossed, so the eye skips them.
Data are the US state crime statistics bundled with statsmodels
(sm.datasets.statecrime, 50 states + DC). Correlations and p-values come from
scipy.stats.pearsonr, the adjustment from
statsmodels.stats.multitest.multipletests(method="holm").
from itertools import combinations

import matplotlib.pyplot as plt
import numpy as np
import statsmodels.api as sm
from scipy import stats
from statsmodels.stats.multitest import multipletests

# Data: US state crime statistics (bundled with statsmodels)
df = sm.datasets.statecrime.load_pandas().data
names = {"violent": "Violent crime", "murder": "Murder", "poverty": "Poverty",
         "single": "Single parents", "hs_grad": "HS graduates", "urban": "Urban", "white": "White"}
df = df[list(names)].rename(columns=names)
k = df.shape[1]

# Pearson r and Holm-adjusted p-values for every pair
pairs = list(combinations(range(k), 2))
tests = [stats.pearsonr(df.iloc[:, i], df.iloc[:, j]) for i, j in pairs]
p_adj = multipletests([t.pvalue for t in tests], method="holm")[1]

fig, ax = plt.subplots(figsize=(7.6, 6.2))
cmap, norm = plt.get_cmap("RdBu"), plt.Normalize(-1, 1)
for (i, j), t, p in zip(pairs, tests, p_adj):
    row, col = j, i                                    # lower triangle: row > column
    sig = p < 0.05
    ax.add_patch(plt.Rectangle((col - 0.5 + 0.03, row - 0.5 + 0.03), 0.94, 0.94,
                               color=cmap(norm(t.statistic)) if sig else "#F2F2F7", lw=0))
    if sig:
        ax.text(col, row, f"{t.statistic:.2f}", ha="center", va="center", fontsize=10.5,
                color="white" if abs(t.statistic) > 0.6 else "#1D1D1F")
    else:
        ax.plot([col - 0.2, col + 0.2], [row - 0.28, row + 0.12], color="#AEAEB2", lw=1)
        ax.plot([col - 0.2, col + 0.2], [row + 0.12, row - 0.28], color="#AEAEB2", lw=1)
        ax.text(col, row + 0.3, f"{t.statistic:.2f}", ha="center", va="center", fontsize=8, color="#8E8E93")

ax.set_xlim(-0.5, k - 1.5)
ax.set_ylim(k - 0.5, 0.5)
ax.set_xticks(range(k - 1), df.columns[:-1], rotation=35, ha="right", rotation_mode="anchor")
ax.set_yticks(range(1, k), df.columns[1:])
ax.set_aspect("equal")
ax.grid(False)
for s in ax.spines.values():
    s.set_visible(False)

cb = fig.colorbar(plt.cm.ScalarMappable(norm=norm, cmap=cmap), ax=ax, shrink=0.7, pad=0.02,
                  ticks=[-1, -0.5, 0, 0.5, 1])
cb.set_label("Pearson r", color="#3A3A3C")
cb.outline.set_visible(False)
ax.set_title("Violent crime tracks single parenthood more than poverty", pad=26)
ax.text(0, 1.02, f"Pearson correlations · n = {len(df)} (50 states + DC) · "
        f"× = not significant (Holm-adjusted p ≥ .05)", transform=ax.transAxes,
        fontsize=9.5, color="#6E6E73")
plt.show()
Figures use the optional PyStatlas style: add plt.style.use("pystatlas.mplstyle") to match the look exactly.
Data source
- US state crime and social indicators, 2009. U.S. Census Bureau. Statistical Abstract of the United States, state tables for 2009 (crime rates from the FBI Uniform Crime Reporting program). https://www.statsmodels.org/stable/datasets/generated/statecrime.html
Compiled for statsmodels (sm.datasets.statecrime); public domain. See the statsmodels page for each variable's table and footnotes.
The examples illustrate statistical methods. Their titles describe what each figure shows in these particular data — often a small, dated or partial sample — not the author's position on the substantive question. For interpretation, context and data quality, rely on the original sources cited here.
How to cite
PyStatlas is created and maintained by Thierry Warin. If it helped your work, please cite it.
Warin, T. (2026). Correlation matrix. In PyStatlas: A Python Gallery of Statistical Graphics for the Social Sciences. https://warint.github.io/pystatlas/correlation/correlation-matrix/
@misc{warin2026statlas,
  author       = {Warin, Thierry},
  title        = {PyStatlas: A Python Gallery of Statistical Graphics for the Social Sciences},
  year         = {2026},
  howpublished = {\url{https://warint.github.io/pystatlas/}},
  note         = {Source code: https://github.com/warint/pystatlas}
}More in Correlation & association
Scatterplot with statistics
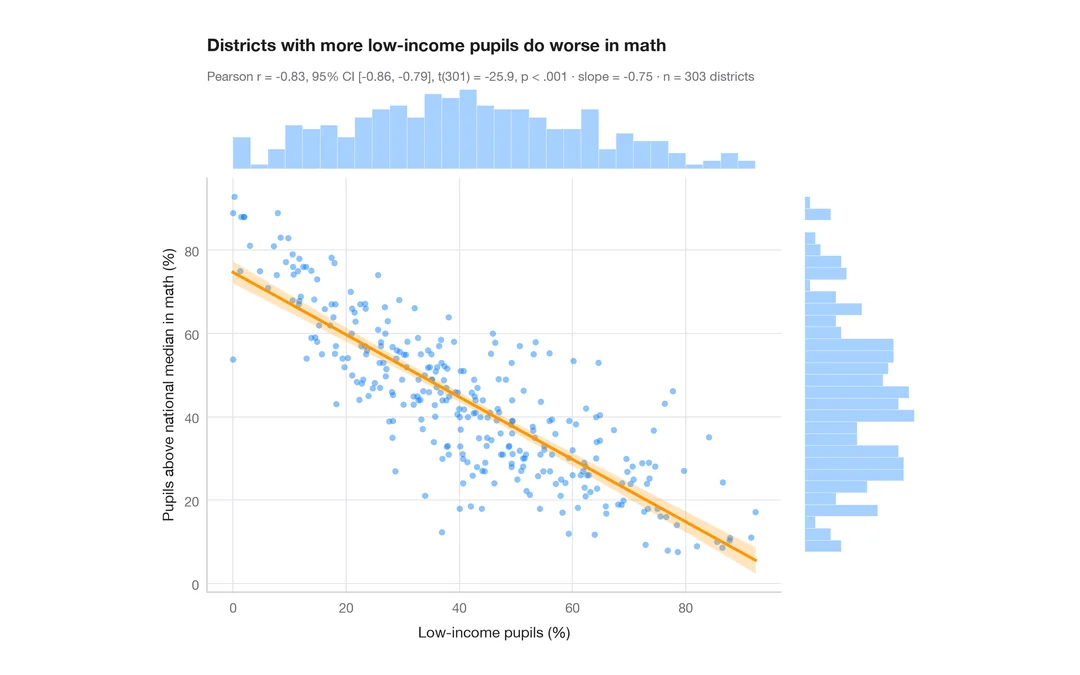
Low-income pupils vs math results in 303 California districts — scatter, OLS line with 95% band, marginal histograms and Pearson's r.
ggstatsplot::ggscatterstats()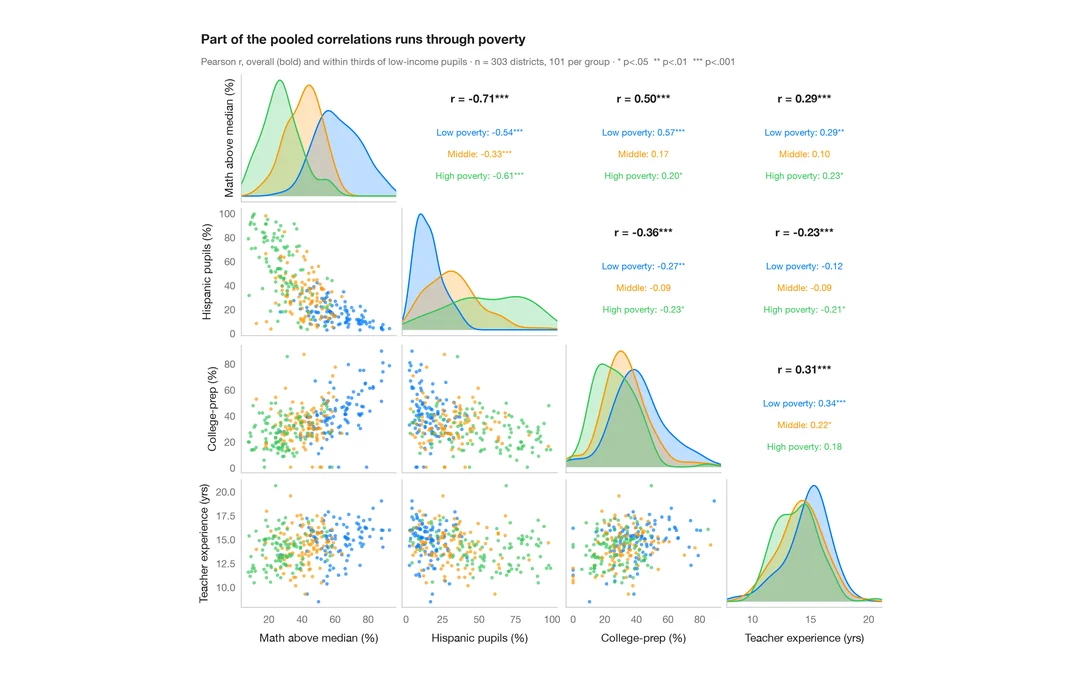
Pairs plot with correlations
Scatter matrix of four school-district variables, with group KDEs on the diagonal and pooled vs within-group correlations above it.
GGally::ggpairs()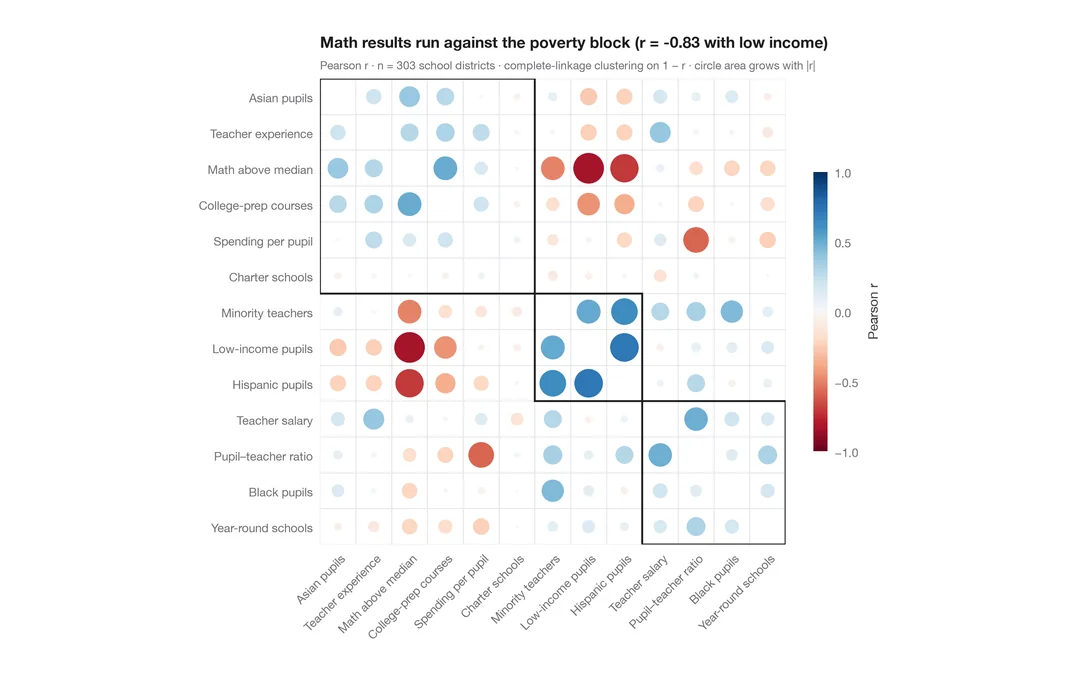
Correlogram with clustering
Corrplot-style circles sized and coloured by r for 13 school-district indicators, ordered by hierarchical clustering.
corrplot::corrplot(order = "hclust", addrect = 3)