Gallery/Survival analysis
Survival analysis
Kaplan–Meier curves with risk tables, cumulative hazards and Cox model hazard ratios.
Survival analysis
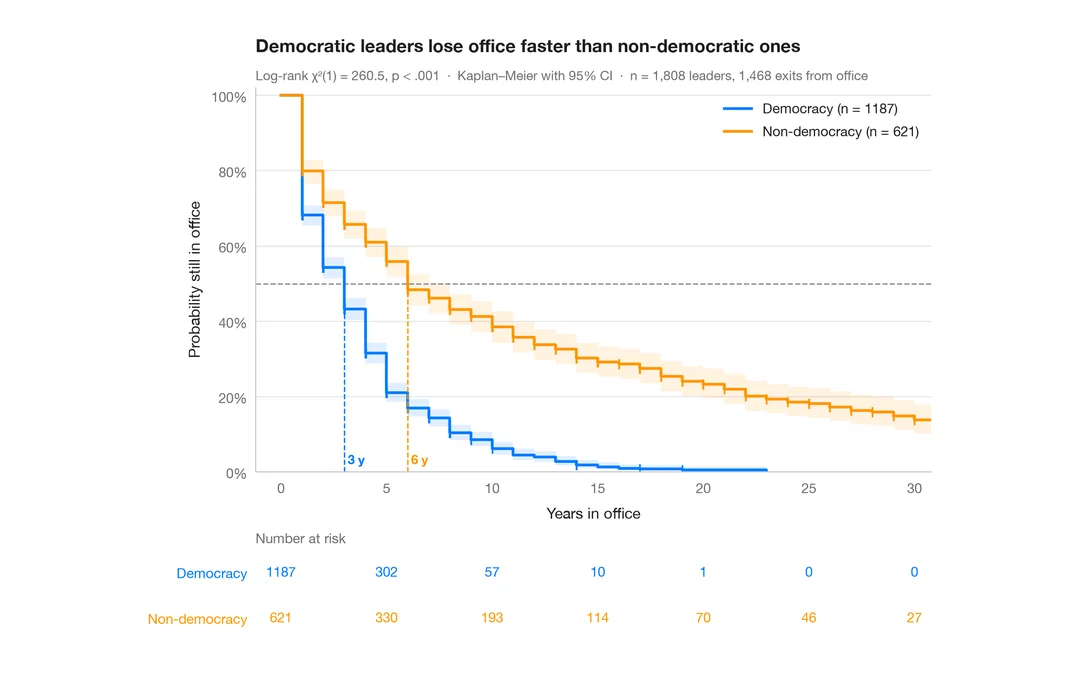
Kaplan–Meier curves
How long political leaders stay in office, democracies vs non-democracies — survival curves with confidence bands, censoring marks, log-rank test and risk table.
survminer::ggsurvplot(risk.table = TRUE)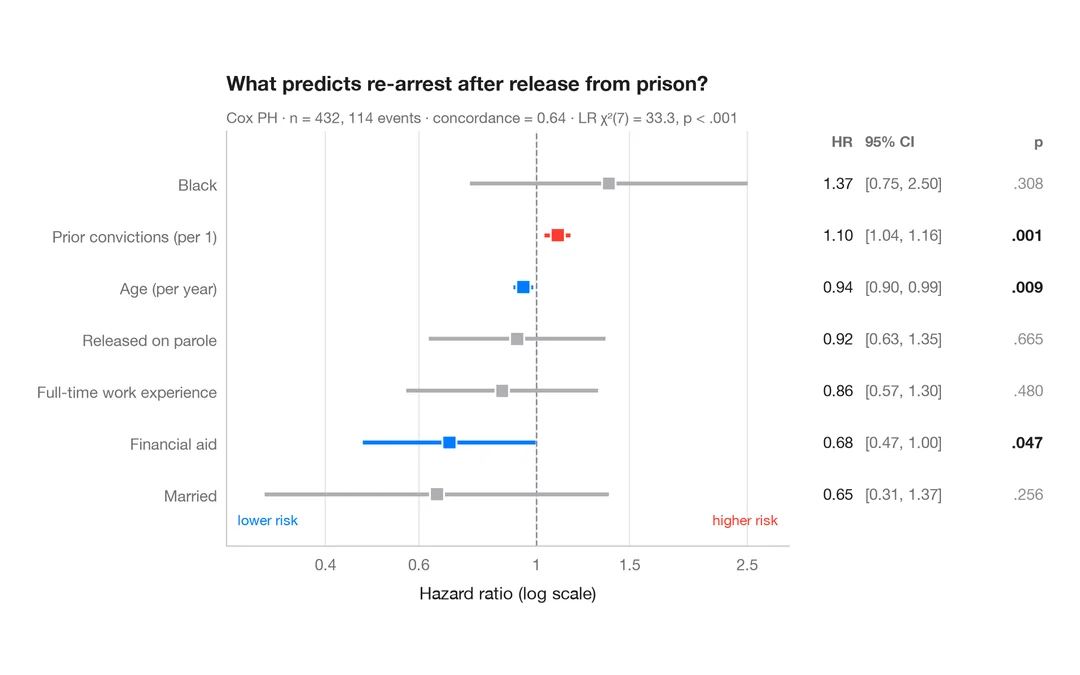
Survival analysis
Cox hazard ratios
Forest plot of a Cox proportional hazards model with HR, 95% CI and p-values.
survminer::ggforest()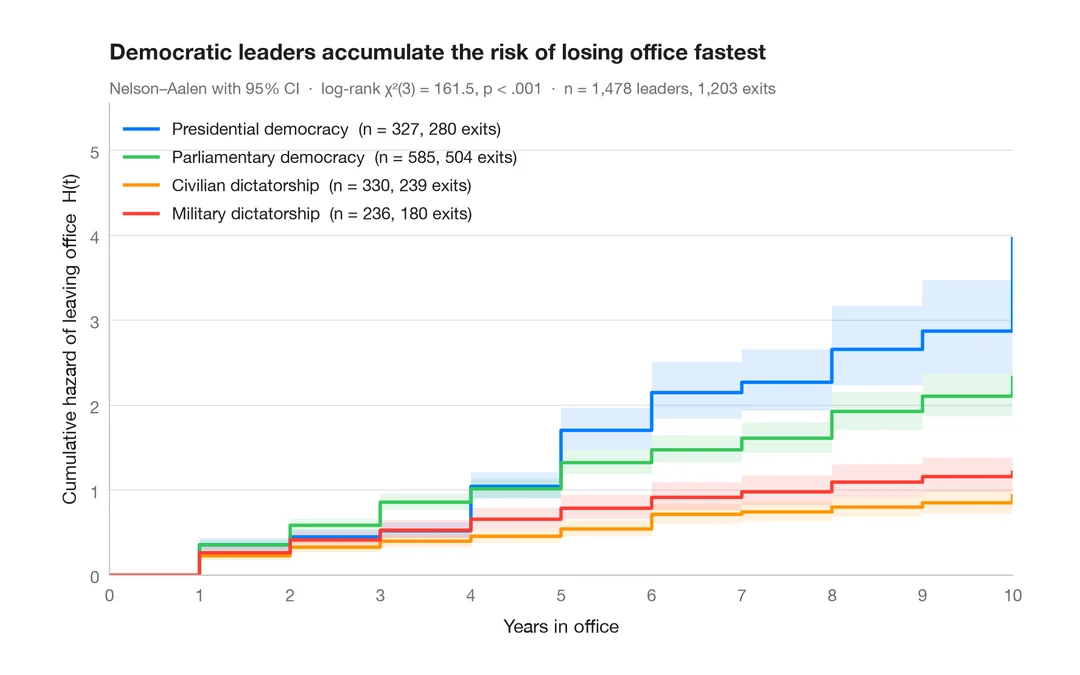
Survival analysis
Cumulative hazard
Nelson–Aalen cumulative hazard of leaving office, with 95% bands, for four political regimes.
survminer::ggsurvplot(fun = "cumhaz")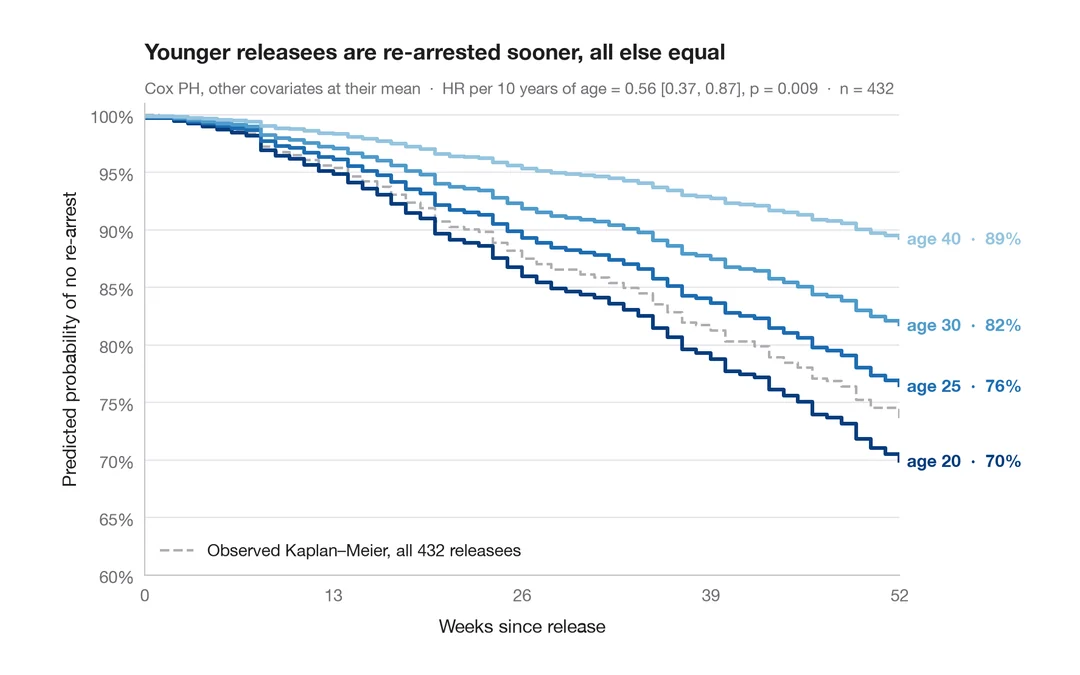
Survival analysis
Adjusted survival curves
Cox model–predicted survival for several ages, other covariates held at their mean.
survminer::ggadjustedcurves()