Gallery/Spatial data
Spatial data
Is a value higher where its neighbours' values are higher? Spatial weights, global and local spatial autocorrelation, and how far clusters reach — on Guerry's 1830s France.
Spatial data
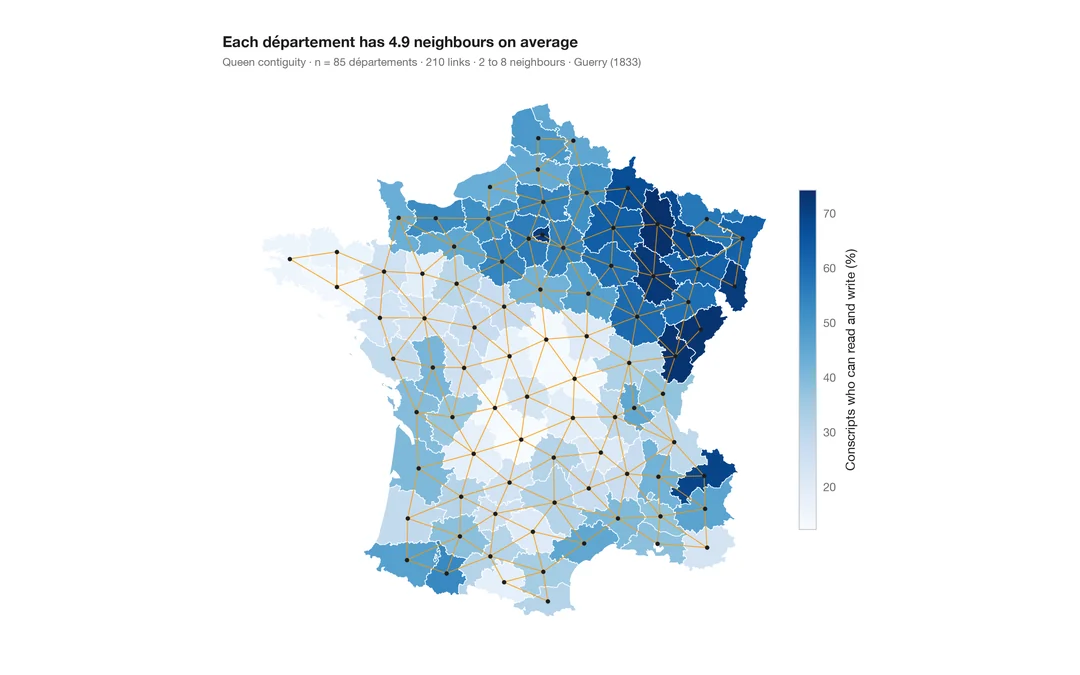
Choropleth with spatial weights
A map of one variable with the neighbour network drawn on top — the structure every spatial statistic relies on.
spdep::poly2nb() + plot(nb, coords)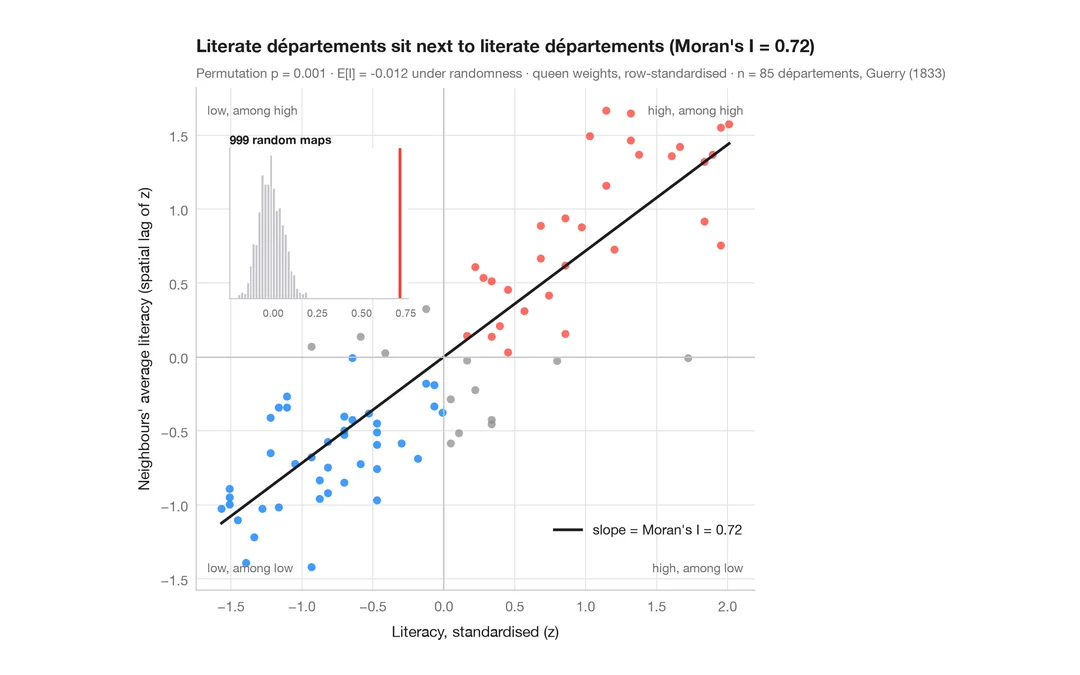
Spatial data
Moran scatterplot (global autocorrelation)
Each area against the average of its neighbours, with Moran's I, its permutation test and the reference distribution.
spdep::moran.plot() + spdep::moran.mc()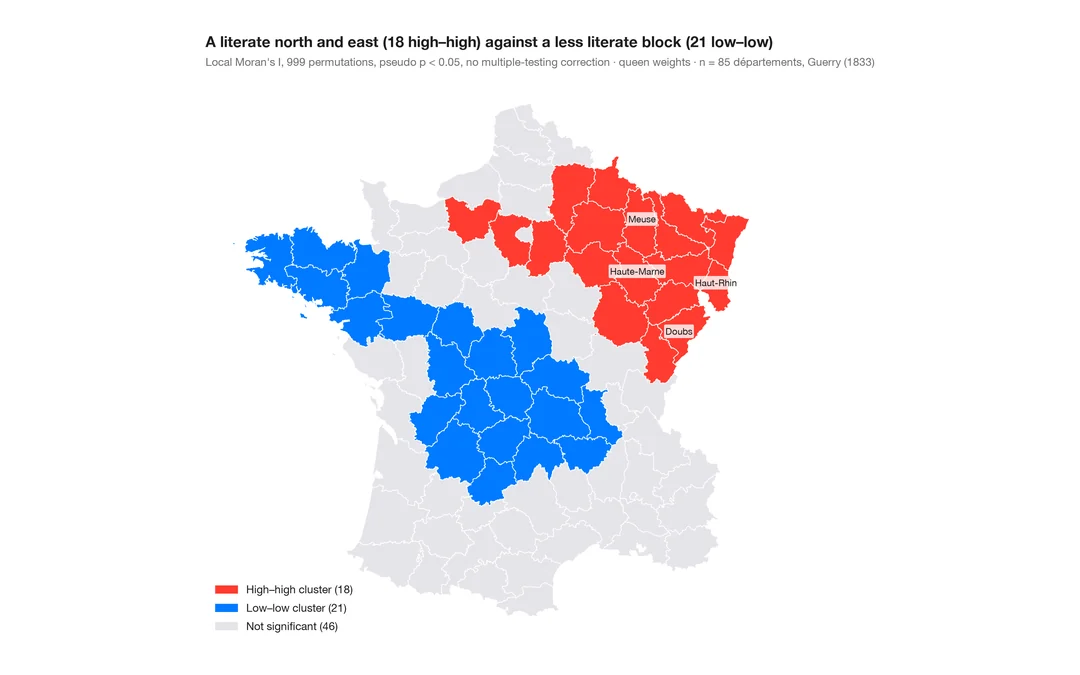
Spatial data
LISA cluster map (local autocorrelation)
Where the clusters and spatial outliers are — local Moran's I for each area, mapped with its permutation significance.
spdep::localmoran_perm() / rgeoda::local_moran()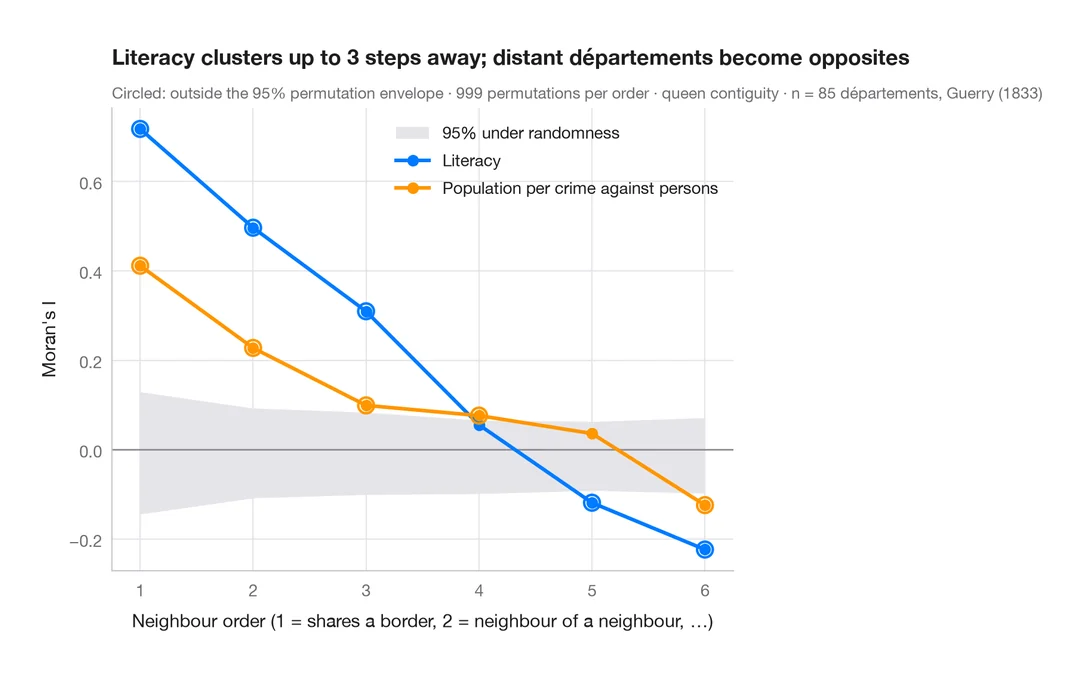
Spatial data
Spatial correlogram
Moran's I at increasing neighbour orders, with a permutation envelope — how far spatial clustering reaches.
spdep::sp.correlogram(method = "I")