Gallery/Multivariate & clustering
Multivariate & clustering
PCA biplots, scree plots, clustering and heatmaps for high-dimensional data.
Multivariate & clustering
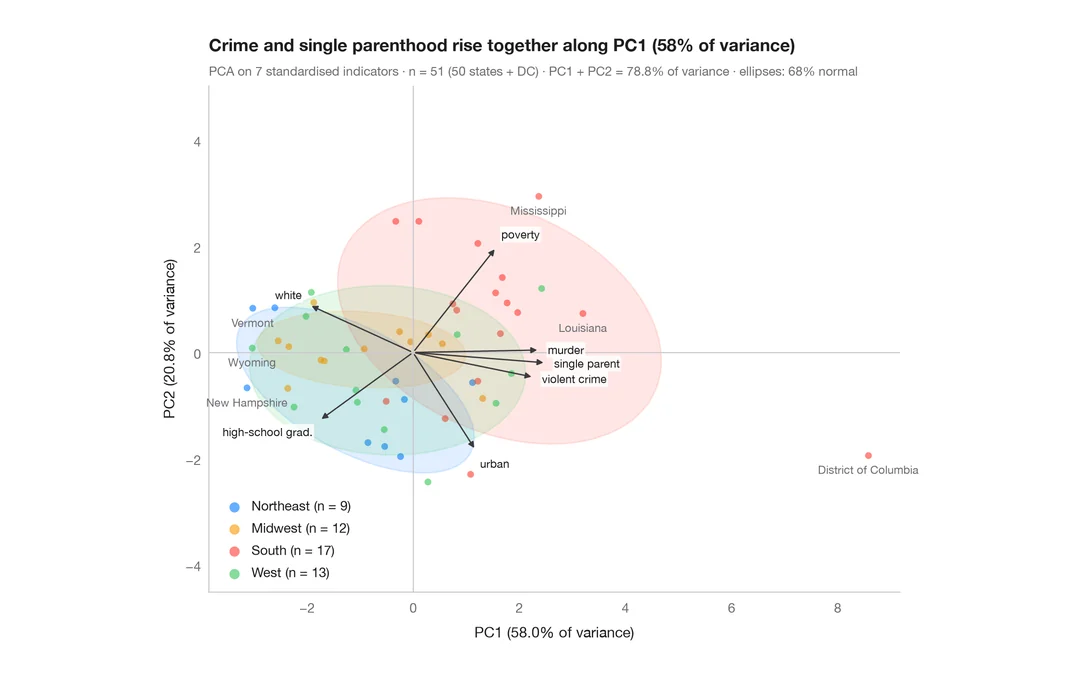
PCA biplot
US states and their social indicators on the first two principal components.
factoextra::fviz_pca_biplot()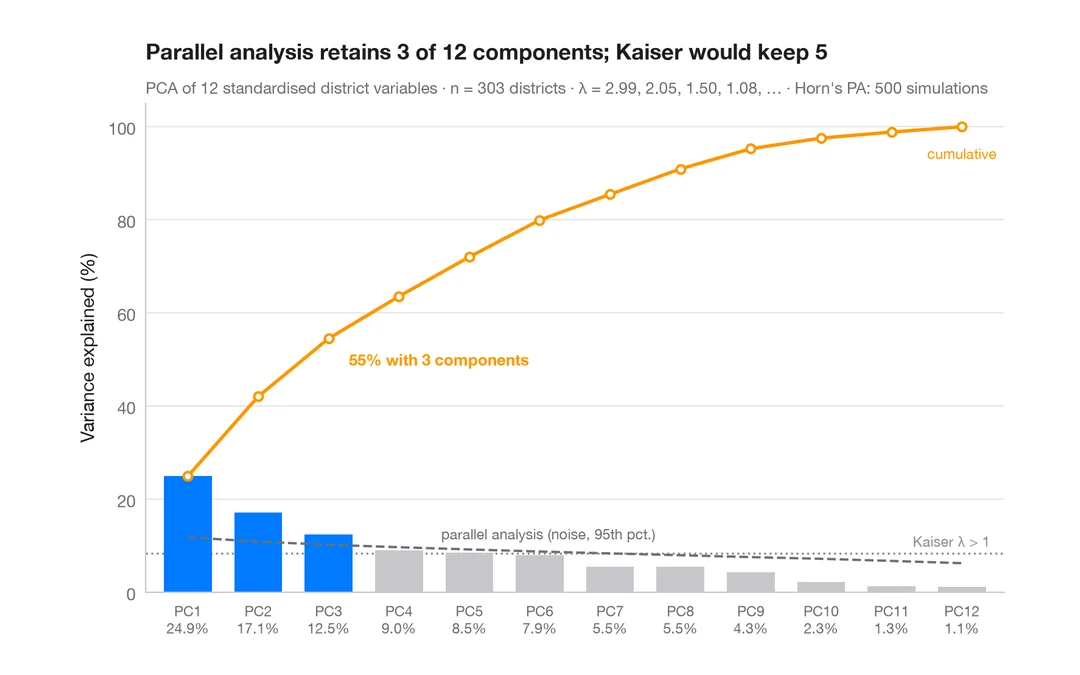
Multivariate & clustering
Scree plot
How many dimensions describe 303 California school districts? Variance per component and a parallel-analysis cut-off.
factoextra::fviz_eig()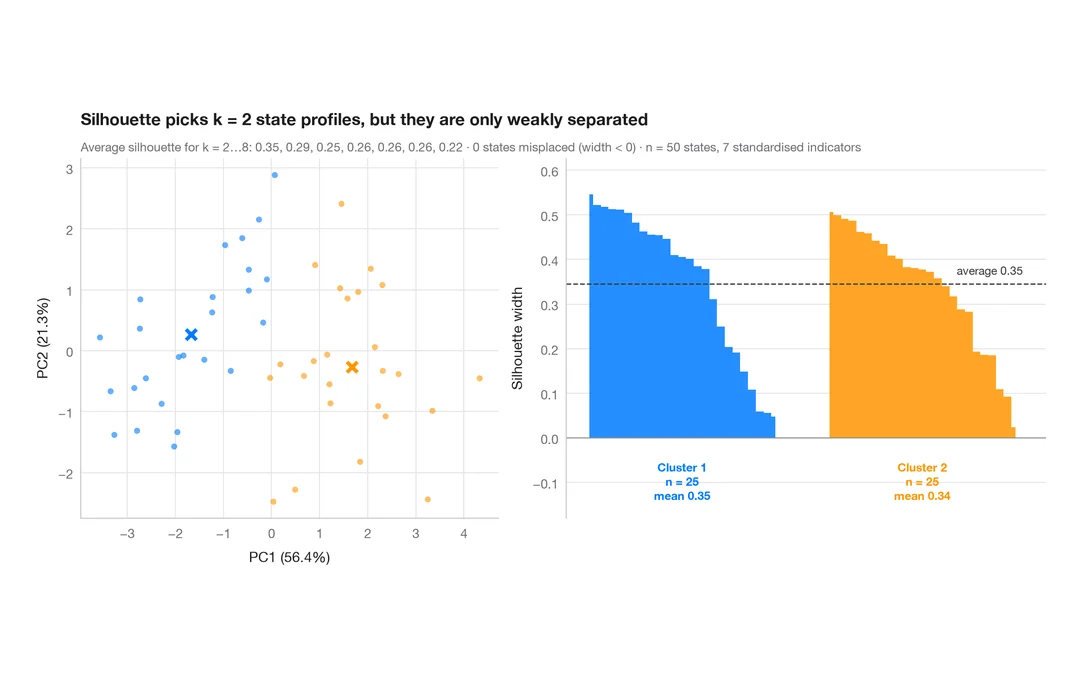
Multivariate & clustering
Silhouette plot for k-means
Do US states fall into distinct social profiles? k-means clusters next to their silhouette widths.
factoextra::fviz_silhouette()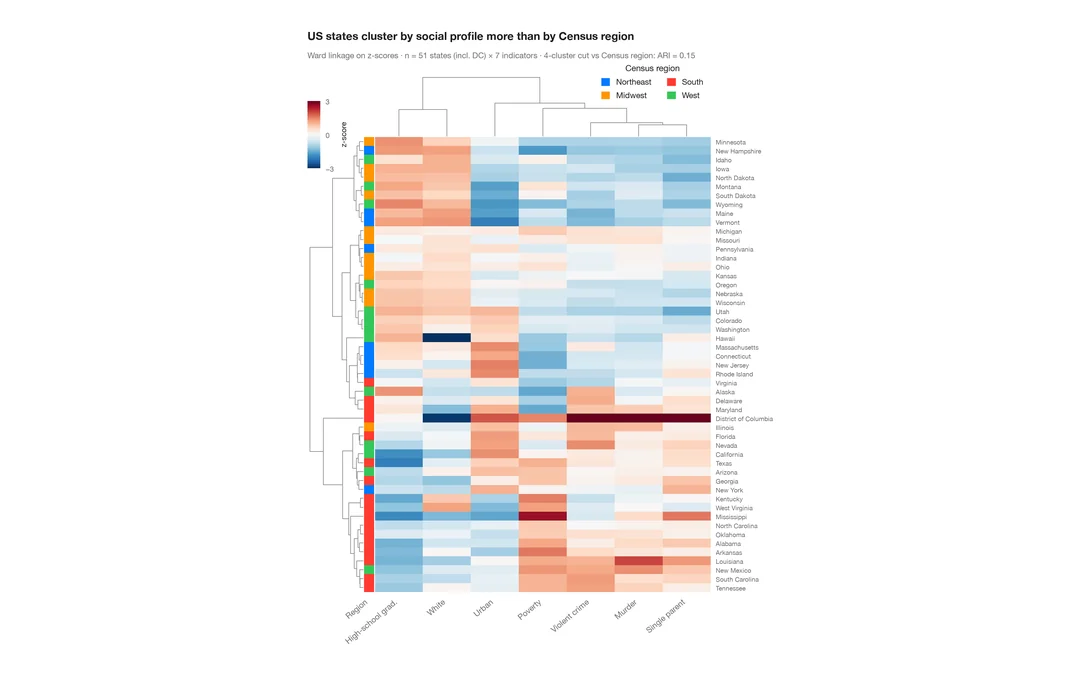
Multivariate & clustering
Clustered heatmap
Z-scored heatmap of US states' social indicators, with row and column dendrograms and a Census-region colour bar.
pheatmap::pheatmap() / ComplexHeatmap::Heatmap()