Gallery/Correlation & association
Correlation & association
Correlation matrices, scatterplots with statistics and pairwise relationships.
Correlation & association
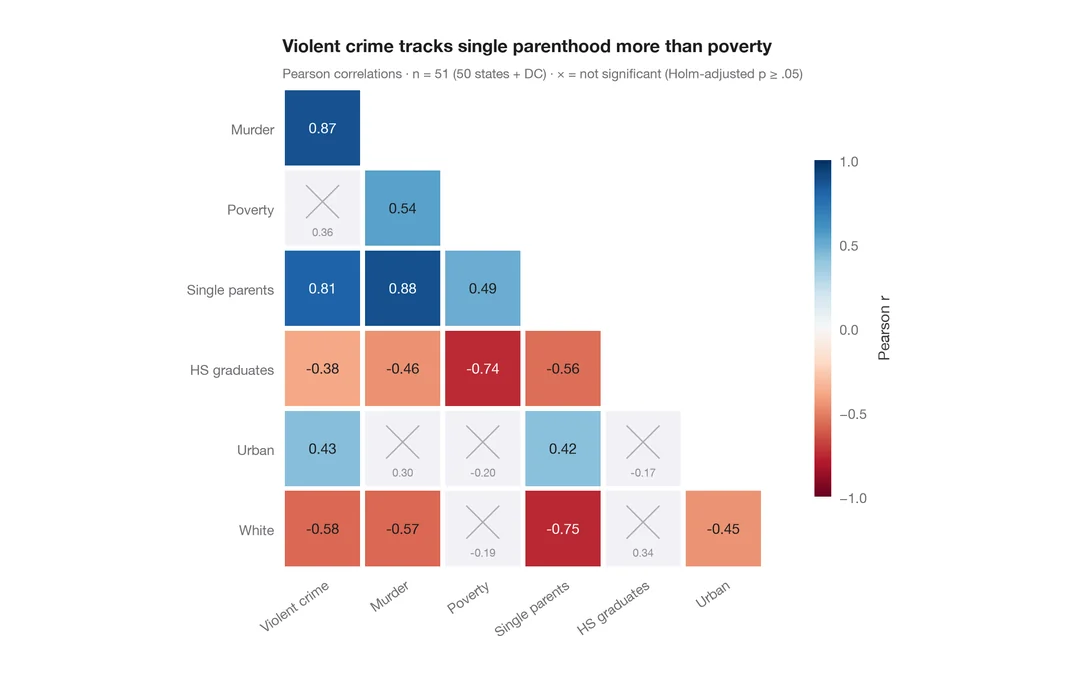
Correlation matrix
Lower-triangle Pearson correlation heatmap; non-significant cells (Holm) are crossed out.
ggstatsplot::ggcorrmat()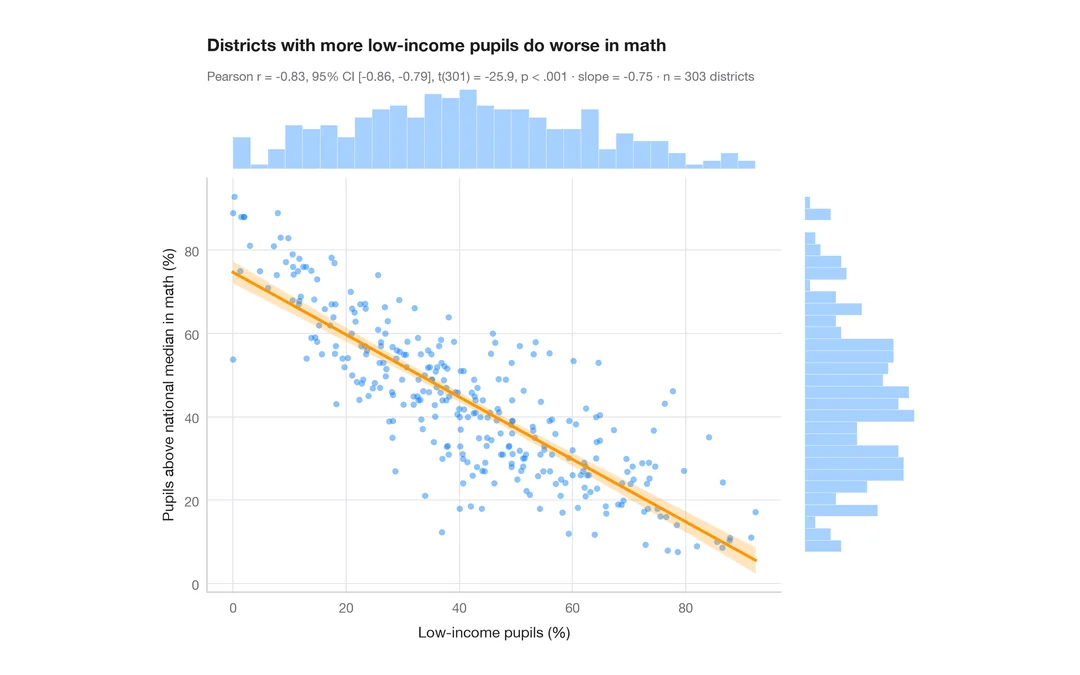
Correlation & association
Scatterplot with statistics
Low-income pupils vs math results in 303 California districts — scatter, OLS line with 95% band, marginal histograms and Pearson's r.
ggstatsplot::ggscatterstats()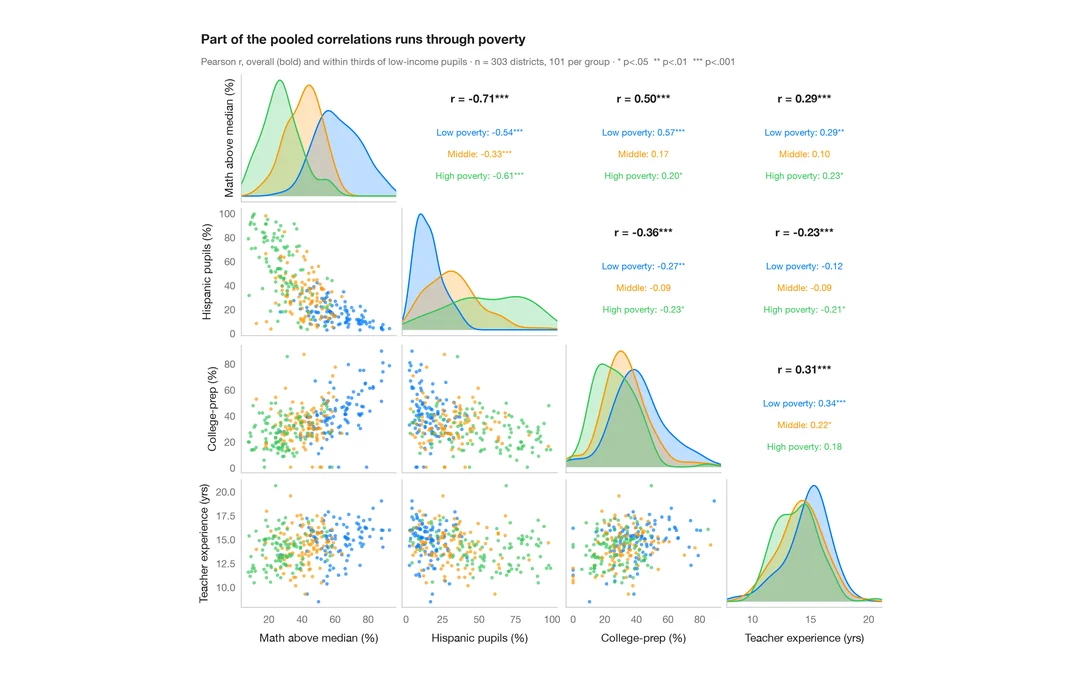
Correlation & association
Pairs plot with correlations
Scatter matrix of four school-district variables, with group KDEs on the diagonal and pooled vs within-group correlations above it.
GGally::ggpairs()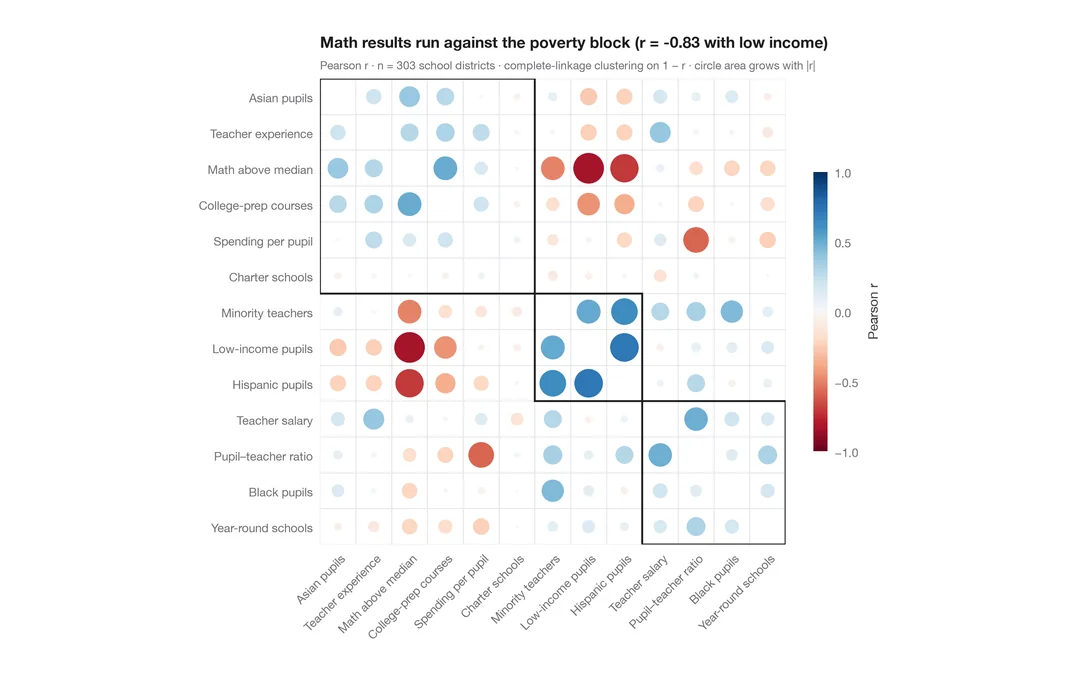
Correlation & association
Correlogram with clustering
Corrplot-style circles sized and coloured by r for 13 school-district indicators, ordered by hierarchical clustering.
corrplot::corrplot(order = "hclust", addrect = 3)