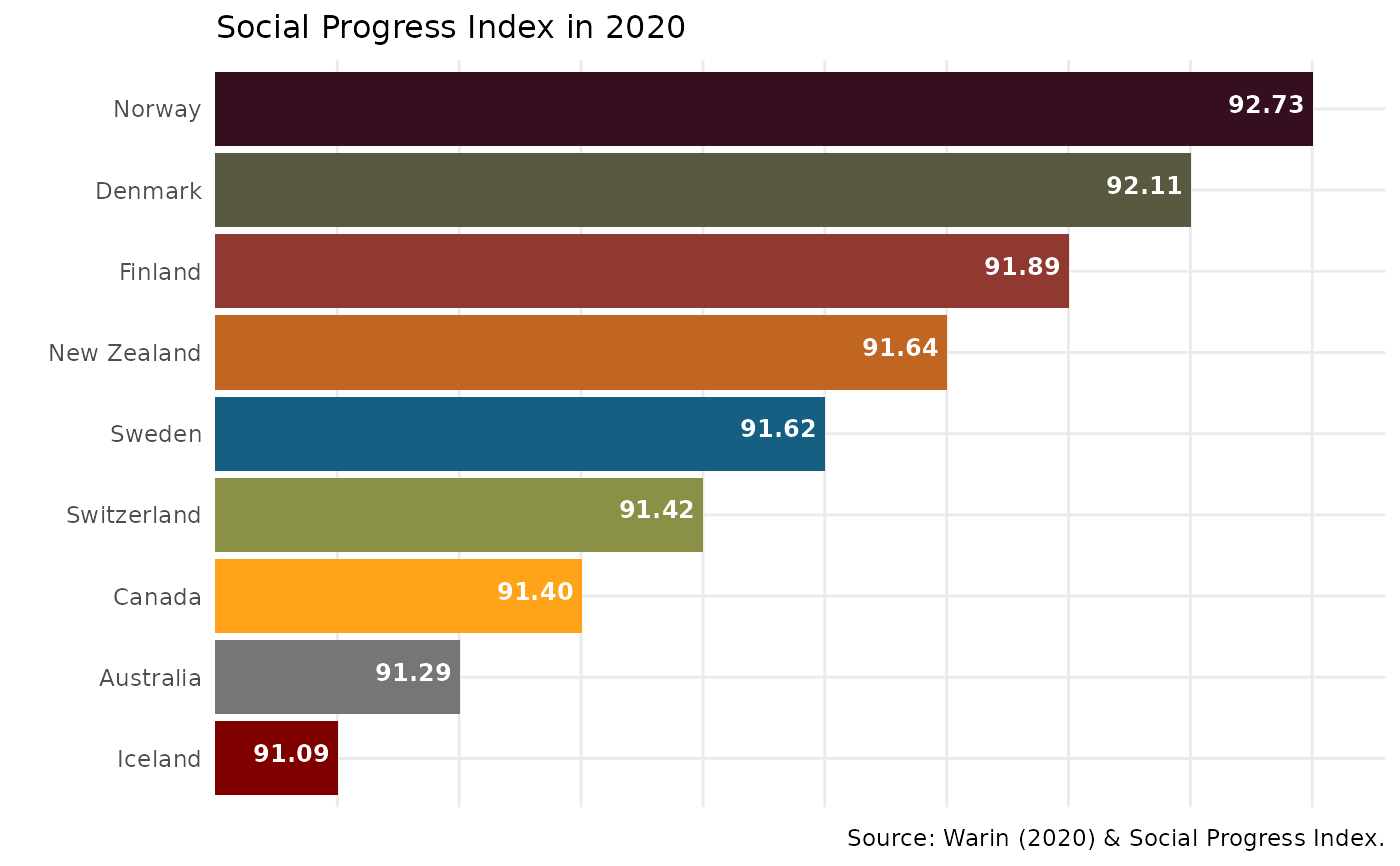
This function allows you to create 2 types of visuals: bar and line charts.
spir_visual(
  chart = "bar_1",
  indicator = "SPI",
  years = max(SPI_data$year),
  title = TRUE
)
Arguments
| chart | Type of charts. |
|---|---|
| indicator | An indicator from the Social Progress Index. |
| years | A chosen year |
| title | Chart title, set by default to TRUE |
Value
Chosen Graph
Examples
spir_visual(chart = "bar_1", indicator = "SPI", years = "2020")