This function allows you to create 3 sorts of visuals: line, bar and point charts.
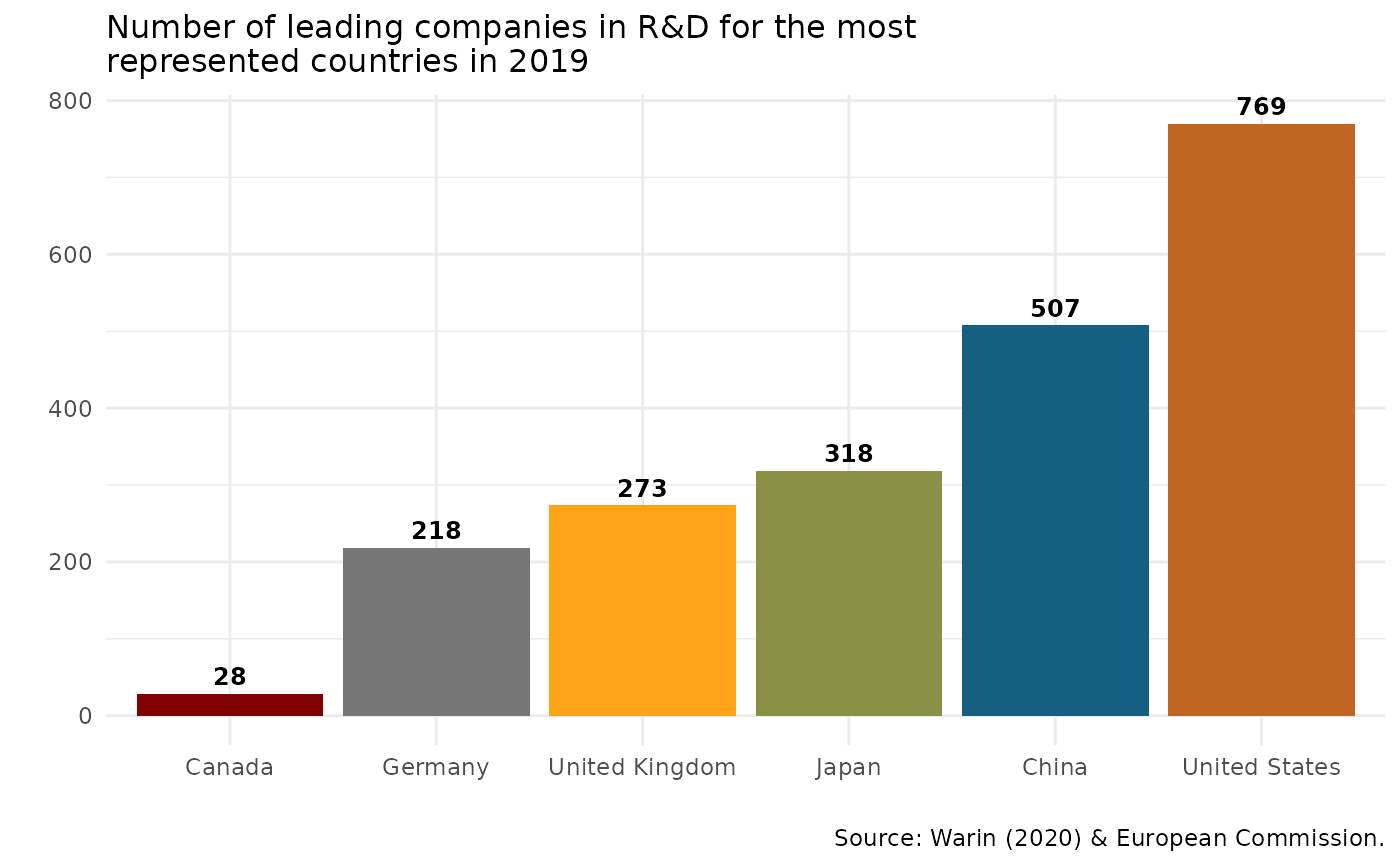
irir_visual(
  country = "CAN",
  chart = "bar_1",
  title = TRUE,
  years = as.numeric(max(IRI_data$year))
)
Arguments
| country | The Country ISO code |
|---|---|
| chart | Type of charts |
| title | Chart title, set by default to TRUE |
| years | Year, only works for bar chart and set by default to max year of IRI's data |
Value
Chosen Graph
See also
irir_country for the IRI's country code, irir_industry for the IRI's industries name, irir_indicator for the IRI's indicators, irir_company for the IRI's companies name and irir_data to collect the data.
Examples
irir_visual(country = "CAN", chart = "bar_1", title = TRUE, years = 2019)