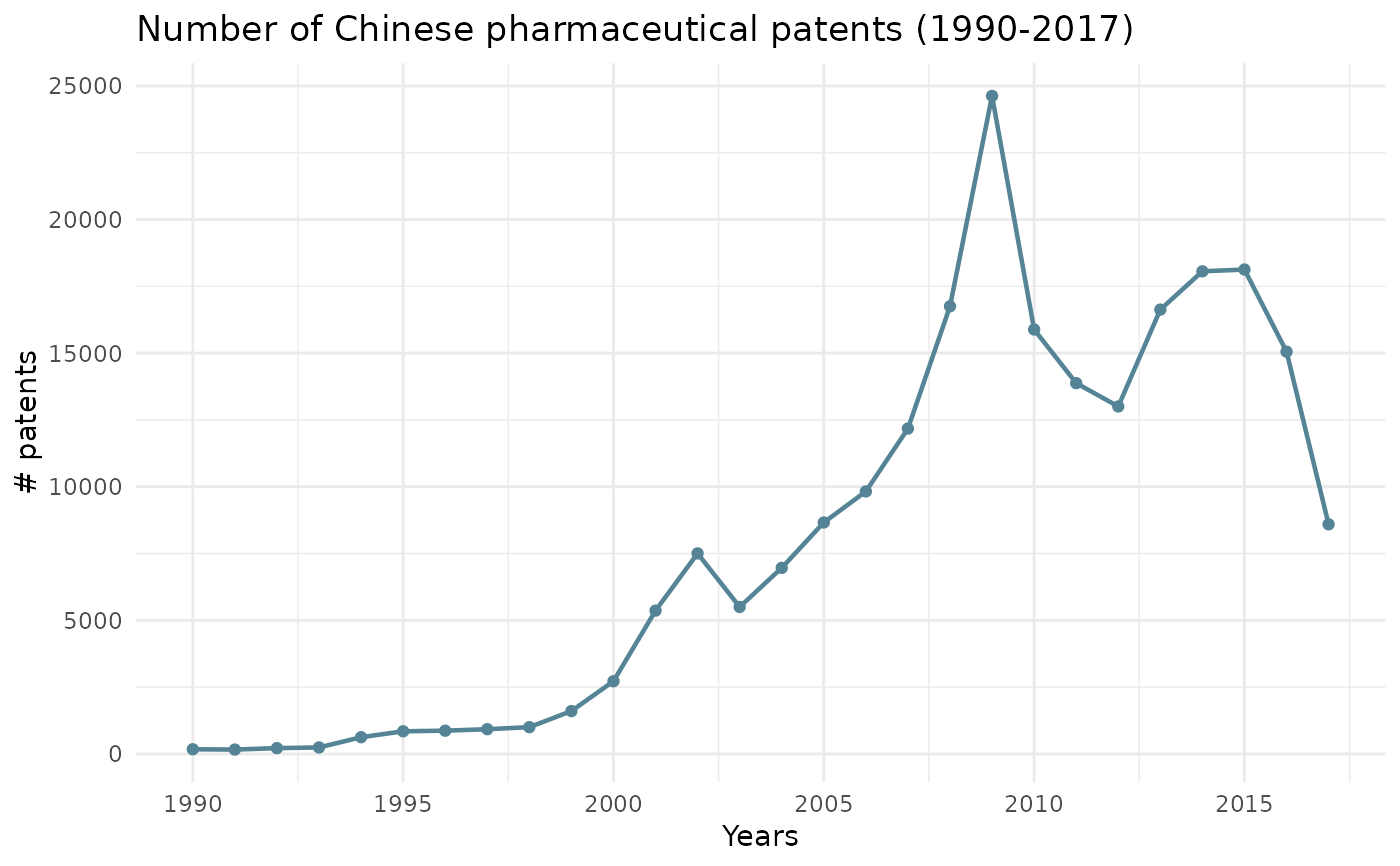
This function allows you to create 4 sorts of visuals: line, bar, box and point charts.
ipcr_visual(chart = "line_1", class = "b14s", title = TRUE)
Arguments
| chart |
Type of charts |
| class |
4-digit class of patent |
| title |
Chart title, set by default to TRUE |
Value
Chosen Graph
Examples
ipcr_visual()